Retail sales declined on a monthly basis in September after sustained summer activity, though annual growth figures demonstrate continued economic momentum as the industry approaches the holiday shopping season. The CNBC/NRF Retail Monitor reported these findings on October 9, 2025, revealing nuanced patterns in consumer spending behavior.
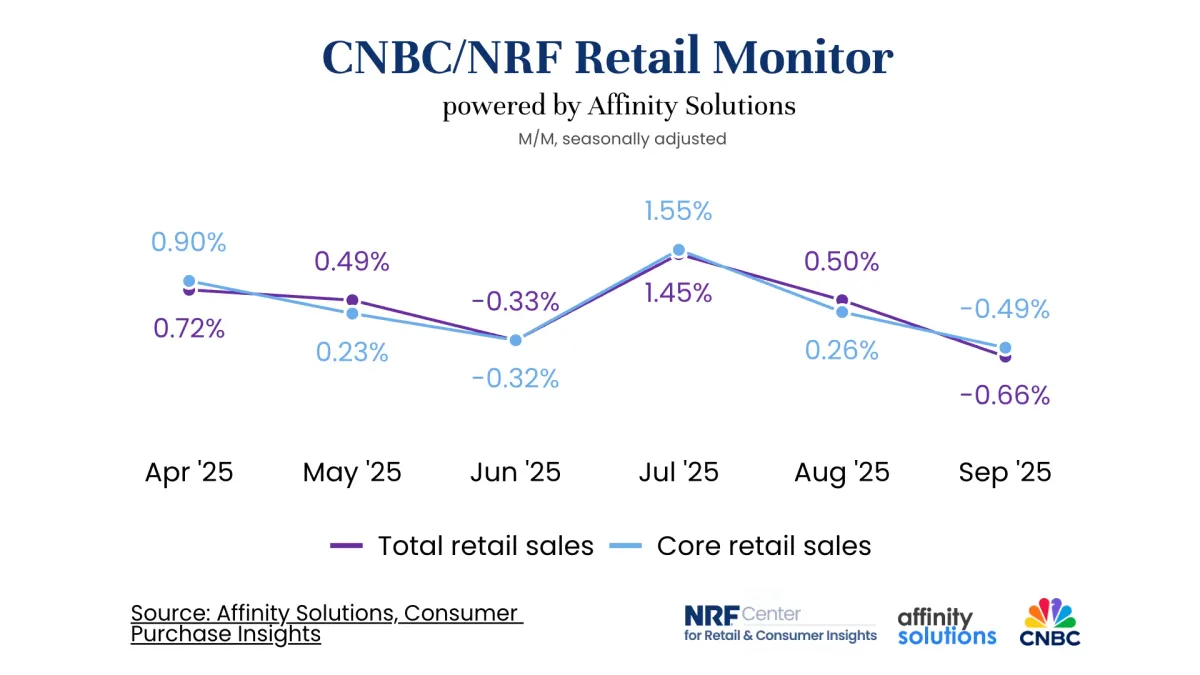
Core retail sales, which exclude restaurants alongside automobile dealers and gasoline stations, decreased 0.49% month-over-month in September on a seasonally adjusted basis. However, the year-over-year comparison showed growth of 5.72% on an unadjusted basis. These figures contrasted with August's performance, when monthly increases reached 0.26% and annual gains hit 6.67%.
Subscribe PPC Land newsletter ✉️ for similar stories like this one. Receive the news every day in your inbox. Free of ads. 10 USD per year.
Subscribe
The National Retail Federation released the data through its collaborative research initiative with CNBC, powered by Affinity Solutions. Unlike traditional survey-based retail measurements, the Retail Monitor analyzes actual anonymized credit and debit card transaction data from over 150 million cards. This methodology eliminates the need for monthly or annual revisions that typically affect Census Bureau figures.
"Retail sales dipped in September as consumers hit the pause button after two solid months of back-to-school spending," stated Matthew Shay, NRF President and CEO. "Amid continued economic uncertainty, consumers opted to preserve spending power in preparation for the important holiday season."
Total retail sales, maintaining the same exclusions of automobiles and gasoline but including restaurants, declined 0.66% month-over-month while advancing 5.42% year-over-year in September. August had shown increases of 0.5% monthly and 6.81% annually for this broader measure.
The first nine months of 2025 demonstrated resilient overall performance. Total sales rose 5.12% year-over-year, while core sales climbed 5.32% for the January through September period.
Category-level analysis revealed divergent trends across retail sectors. Digital products led annual growth at 21.35% year-over-year, though monthly performance registered a modest 0.52% gain. Sporting goods, hobby, music and book stores followed with 8.81% annual growth and 0.74% monthly increases.
Clothing and accessories stores posted 7.35% year-over-year gains despite a 1.06% monthly decline. General merchandise stores showed similar patterns with 5.52% annual growth offset by a 0.62% monthly decrease. Five of the nine tracked categories experienced month-over-month declines.
Grocery and beverage stores fell 0.76% monthly but maintained 4.79% annual growth. Health and personal care stores rose 0.38% monthly and 4.65% annually. Electronics and appliance stores declined 0.12% monthly while achieving 4.43% yearly gains.
Furniture and home furnishings stores experienced the sharpest monthly contraction at 1.87%, though annual figures remained positive at 0.56%. Building and garden supply stores represented the sole category with negative annual performance, declining 1.2% year-over-year despite a 0.53% monthly increase.
The September data arrives amid broader economic considerations affecting retail advertising strategies. IAB downward revisions to 2025 advertising forecasts reflected mounting concerns about tariff impacts, particularly in automotive, retail, and consumer electronics sectors. These macroeconomic pressures have intensified focus on performance-driven advertising approaches.
Consumer spending patterns influence retail media investment decisions, particularly as the sector continues rapid expansion. Retail media is projected to capture 20% of global advertising revenue by 2030, exceeding $300 billion according to Omdia research. The September spending slowdown could affect short-term retail media inventory availability and pricing dynamics.
Affinity Solutions provides the data infrastructure underlying the Retail Monitor. The company maintains access to fully permissioned data from over 150 million debit and credit cards across U.S. and U.K. markets. This information transforms into privacy-compliant intelligence for marketers, consultancies, and financial services firms.
Subscribe PPC Land newsletter ✉️ for similar stories like this one. Receive the news every day in your inbox. Free of ads. 10 USD per year.
Subscribe
The correlation between Retail Monitor figures and U.S. Census Bureau revised retail sales numbers has established the metric as a reliable forward indicator. The real-time nature of card transaction data provides merchants and advertisers with earlier visibility into consumer behavior shifts compared to traditional government reporting schedules.
Shay characterized the year-over-year performance as demonstrating "robust growth" that signals "momentum as we head into the holidays." The assessment reflects industry optimism despite monthly fluctuations driven by consumer responses to changing economic circumstances.
The September decline follows what retailers described as "two solid months of back-to-school spending" that drove elevated July and August activity. This seasonal pattern suggests consumers front-loaded discretionary purchases during promotional periods, then reduced spending ahead of anticipated holiday shopping.
European retail media partnerships have expanded as brands work with four to six retail media networks, more than doubling from earlier periods. This diversification strategy indicates retailers worldwide are investing in digital advertising infrastructure to capture consumer attention across multiple touchpoints.
The interplay between consumer spending patterns and advertising strategy becomes particularly significant during transitional periods. Retailers typically increase marketing expenditures ahead of holiday seasons to capture demand, while simultaneously monitoring spending velocity indicators for budget allocation decisions.
Buy ads on PPC Land. PPC Land has standard and native ad formats via major DSPs and ad platforms like Google Ads. Via an auction CPM, you can reach industry professionals.
Learn more
September's grocery and beverage category declined 0.76% monthly, potentially reflecting consumer price sensitivity in essential goods categories. The segment maintained 4.79% annual growth, suggesting continued underlying demand despite short-term adjustments.
Digital products' exceptional 21.35% annual growth rate substantially outpaced all other categories. This performance aligns with broader digital transformation trends affecting consumer behavior and merchant investment priorities. The category's 0.52% monthly increase indicated sustained rather than accelerated momentum.
Sporting goods stores achieved 8.81% annual gains, positioning the category as the second-strongest performer. The 0.74% monthly increase suggested continued discretionary spending in recreational equipment despite overall retail deceleration.
Health and personal care stores demonstrated resilience with both monthly and annual gains at 0.38% and 4.65% respectively. This stability indicates consistent demand in health-related retail categories regardless of broader spending fluctuations.
Building and garden supply stores' negative 1.2% annual performance stood as the sole declining category on a yearly basis. The 0.53% monthly increase suggested potential stabilization following earlier weakness, possibly reflecting seasonal factors affecting outdoor and home improvement spending.
The Retail Monitor methodology leverages card transaction data collected directly from financial institutions. Affinity Solutions processes this information to generate aggregated spending insights while maintaining individual consumer privacy through anonymization protocols.
CNBC analyst Steve Liesman presented the September findings during the network's October 9, 2025 broadcast, characterizing consumer behavior as cautious positioning ahead of holiday spending. The interpretation emphasized the strategic nature of the spending pause rather than fundamental demand weakness.
The National Retail Federation, founded over a century ago, represents the retail industry's primary advocacy organization. Based in Washington, D.C., the organization develops research initiatives alongside policy positions affecting the sector's approximately 55 million employees.
Monthly volatility in retail sales data reflects normal consumer response patterns to economic signals, promotional calendars, and seasonal factors. The persistent strength of year-over-year comparisons provides industry participants with confidence in underlying demand trends despite short-term fluctuations.
September's mixed category performance illustrates differentiated consumer priorities. Discretionary categories including furniture and clothing experienced sharper monthly declines, while necessity-oriented categories like health and personal care maintained steadier performance.
The partnership between CNBC, the National Retail Federation, and Affinity Solutions launched the Retail Monitor to provide market participants with real-time visibility into consumer spending trends. The collaboration addresses demand for faster, more accurate retail performance indicators compared to traditional government statistical releases.
Retailers entering the fourth quarter face the industry's most critical revenue period. Holiday shopping typically generates disproportionate annual sales and profit contributions, making September and October spending patterns particularly significant for forecasting and planning purposes.
Consumer electronics and appliance stores' modest 4.43% annual growth and 0.12% monthly decline reflected ongoing category challenges. The sector continues adapting to post-pandemic demand normalization and evolving consumer technology preferences.
The Retail Monitor's correlation with Census Bureau revised figures establishes credibility for the alternative measurement approach. Government statistics require multiple revisions as survey responses arrive and seasonal adjustments refine, while card transaction data provides immediate accuracy.
Furniture and home furnishings stores' 1.87% monthly decline represented the sharpest contraction among tracked categories. The segment's 0.56% annual growth indicated minimal expansion in a category heavily influenced by housing market conditions and discretionary spending capacity.
General merchandise stores encompass diverse retail formats including department stores and mass merchants. The category's 0.62% monthly decline and 5.52% annual growth reflected competitive pressures and evolving consumer shopping preferences across these traditional retail channels.
Clothing and accessories stores' 7.35% annual growth demonstrated sustained apparel demand despite the 1.06% monthly September decrease. The seasonal nature of clothing retail amplifies back-to-school and holiday periods while producing intervening slowdowns.
The September data provides retailers and advertisers with quantitative evidence supporting strategic fourth-quarter planning. Consumer preservation of spending power ahead of holidays suggests concentrated demand during November and December promotional periods.
Subscribe PPC Land newsletter ✉️ for similar stories like this one. Receive the news every day in your inbox. Free of ads. 10 USD per year.
Subscribe
Timeline
Subscribe PPC Land newsletter ✉️ for similar stories like this one. Receive the news every day in your inbox. Free of ads. 10 USD per year.
Subscribe
Summary
Who: The National Retail Federation, in collaboration with CNBC and powered by Affinity Solutions, released retail spending data affecting retailers, advertisers, and marketing professionals making budget allocation decisions for the holiday season.
What: Core retail sales (excluding restaurants, automobiles, and gasoline) declined 0.49% month-over-month in September 2025 but increased 5.72% year-over-year, with digital products leading annual growth at 21.35% while five of nine tracked categories experienced monthly declines.
When: The data was released on October 9, 2025, covering September 2025 performance following two strong months of back-to-school spending in July and August, with implications for fourth-quarter holiday retail planning.
Where: The figures apply to U.S. retail markets tracked through anonymized transaction data from over 150 million debit and credit cards, with category-level analysis spanning digital products, sporting goods, clothing, general merchandise, grocery, health and personal care, electronics, furniture, and building supply stores.
Why: Consumers strategically reduced September spending to preserve purchasing power ahead of the holiday season amid continued economic uncertainty, following sustained back-to-school expenditures, while year-over-year growth demonstrates underlying retail momentum that supports optimistic fourth-quarter forecasts despite monthly volatility driven by changing economic circumstances.
Share this article
The link has been copied!