United States retail sales drop as recession fears grow in June
Spending falls 0.33% as consumers worry about economy and advertising budgets may shrink.

Retail sales experienced their first monthly decline since February 2025, falling 0.33% on a seasonally adjusted basis in June, according to data released July 11, 2025, by the National Retail Federation's CNBC/NRF Retail Monitor. The decline occurred across nearly all sectors as consumer concerns about government policies and economic uncertainty began influencing household budget decisions.
Total retail sales, excluding automobiles and gasoline, dropped 0.33% month-over-month but maintained 3.19% growth year-over-year when unadjusted. May had shown positive momentum with 0.49% monthly growth and 4.44% annual increases. Core retail sales, which exclude restaurants alongside automobile dealers and gasoline stations, declined 0.32% monthly while advancing 3.36% annually.
Subscribe the PPC Land newsletter ✉️ for similar stories like this one. Receive the news every day in your inbox. Free of ads. 10 USD per year.
Who: National Retail Federation releasing CNBC/NRF Retail Monitor data powered by Affinity Solutions, affecting retailers, consumers, and marketing professionals across the digital advertising ecosystem.
What: U.S. retail sales declined 0.33% month-over-month in June 2025, marking the first decrease since February, with declines across eight of nine categories while maintaining 3.19% annual growth.
When: Data released July 11, 2025, covering June 2025 retail performance, representing the first monthly decline following three months of positive growth.
Where: United States retail market excluding automobiles and gasoline, with data compiled from anonymized credit and debit card transactions nationwide.
Why: Prolonged uncertainty surrounding economic policies, tariffs, and trade decisions prompted consumers to adopt cautious "wait-and-see" spending approaches, despite intact economic fundamentals and continued consumer purchasing power.
Subscribe the PPC Land newsletter ✉️ for similar stories like this one. Receive the news every day in your inbox. Free of ads. 10 USD per year.
"June's numbers indicate that prolonged uncertainty surrounding the economy, tariffs and trade policy could be pushing consumers to adopt a 'wait-and-see' approach with their household budgets," stated NRF President and CEO Matthew Shay. The economic fundamentals haven't been disrupted yet, but consumers are showing increased caution in their spending patterns.
The retail spending slowdown carries significant implications for the digital advertising industry, particularly as retail media has emerged as the fastest-growing advertising segment. When consumer spending contracts, retailers typically adjust their marketing budgets accordingly, potentially impacting the advertising ecosystem that has benefited from robust e-commerce growth.
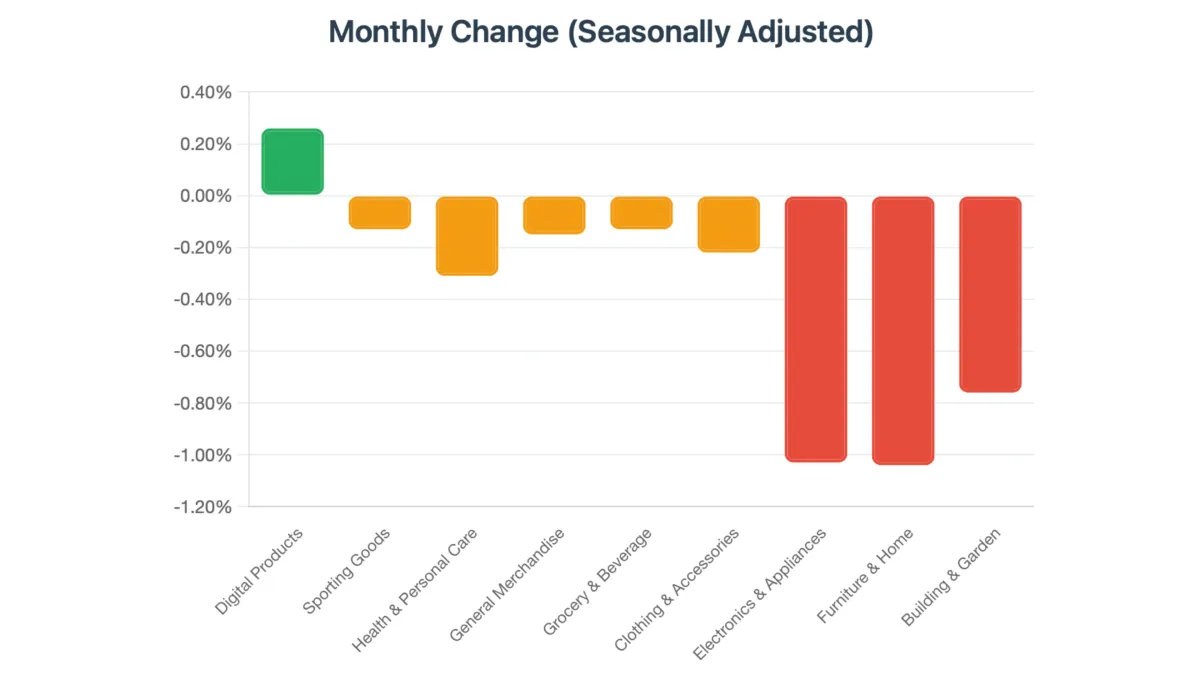
Eight of nine retail categories experienced monthly declines, with only digital products showing modest 0.26% growth. Electronics and appliance stores suffered the steepest drop at 1.03%, followed closely by furniture and home furnishings at 1.04%. Building and garden supply stores declined 0.76% monthly and posted the most concerning annual decline of 5.33%.
The data presents a mixed picture when examining year-over-year performance. Digital products led annual growth at 24.11%, followed by sporting goods stores at 8.52% and health and personal care stores at 3.47%. General merchandise maintained 3.18% annual growth, while grocery and beverage stores expanded 2.59%.
Consumer behavior patterns suggest increasing price sensitivity and delayed purchase decisions. The furniture and home furnishings sector's 1.14% annual decline indicates consumers are postponing major discretionary purchases. Electronics purchases remain subdued with only 2.43% annual growth despite the category's typically strong performance.
For marketing professionals, these trends signal potential budget reallocations ahead. European digital advertising demonstrated resilience with 16% growth despite economic uncertainty, but sustained consumer spending weakness could pressure advertising investments. The retail media segment, which has been experiencing explosive growth, may face headwinds if retailer revenue pressures mount.
The retail monitor utilizes actual anonymized credit and debit card purchase data compiled by Affinity Solutions, providing more immediate insights than survey-based Census Bureau numbers that require monthly and annual revisions. This real-time data approach offers marketers timely signals about consumer behavior shifts.
Economic policy uncertainty remains a central concern. Shay noted that while the 'Big Beautiful Bill' provides economic growth support, "unresolved and restrictive trade policies remain a significant headwind." Tariff concerns specifically appear to be influencing consumer psychology, potentially creating lasting behavioral changes even if economic fundamentals remain solid.
The June decline represents the first negative monthly movement since February's 0.22% decrease for both total and core sales. Monthly consistency had characterized recent quarters, making June's reversal particularly noteworthy for trend analysis.
Building and garden supply stores faced the most challenging conditions with 5.33% annual declines, suggesting consumers are delaying home improvement projects. This category's weakness extends beyond seasonal factors, indicating deeper spending hesitation among homeowners.
Digital products' outperformance reflects ongoing consumption pattern shifts toward entertainment and digital services. This 24.11% annual growth rate substantially exceeds physical retail categories, highlighting the continued digital transformation of consumer spending.
Clothing and accessories stores managed 2.71% annual growth despite 0.22% monthly decline, indicating seasonal purchasing patterns may be shifting. The apparel sector's performance often serves as a discretionary spending indicator for broader economic health.
The first six months of 2025 showed total sales advancing 4.66% year-over-year and core sales growing 4.93%. These figures suggest underlying economic strength persists despite June's monthly weakness. However, the deceleration from May's stronger performance indicates momentum loss.
NRF's role as the retail industry's leading authority provides credibility to these findings. The organization represents the nation's largest private-sector employer, with retail contributing $5.3 trillion to annual GDP and supporting 55 million American jobs.
Retail sales patterns influence digital advertising spending through multiple channels. When physical store traffic decreases, retailers often increase online marketing investments to maintain revenue. Conversely, overall revenue pressure can constrain total advertising budgets regardless of channel effectiveness.
The CNBC/NRF Retail Monitor's methodology advantages include real-time data processing and elimination of revision requirements that characterize government statistics. This immediacy provides marketing professionals with faster insights for campaign optimization and budget planning.
Economic uncertainty's psychological impact on consumers may persist beyond immediate policy resolutions. Consumer sentiment can lag economic improvements, suggesting marketing strategies should account for potentially extended periods of cautious spending behavior.
Grocery and beverage stores' 2.59% annual growth with only 0.13% monthly decline demonstrates essential categories' relative stability. Non-discretionary spending maintains consistency even during uncertain periods, providing baseline demand for related advertising categories.
Health and personal care stores' 3.47% annual growth indicates consumers continue prioritizing wellness-related purchases. This category's resilience often characterizes economic downturns, making it attractive for sustained marketing investments.
The retail landscape's evolution continues despite monthly fluctuations. Digital commerce trends remain strong, with e-commerce penetration increasing across categories. Marketing professionals should distinguish between temporary consumer caution and longer-term digital transformation patterns.
Sporting goods stores' 8.52% annual growth contrasts with modest monthly decline, suggesting seasonal factors rather than fundamental weakness. Recreation and fitness categories often maintain consumer priority during economic uncertainty.
General merchandise stores' 3.18% annual growth with slight monthly decline reflects broader economic patterns affecting large-format retailers. These establishments serve as economic bellwethers due to their diverse product offerings and consumer base breadth.
The June data reinforces the importance of agile marketing strategies that can respond quickly to consumer behavior changes. Real-time retail sales monitoring provides early warning signals for advertising budget adjustments and campaign optimization decisions.
Digital products emerged as the sole category demonstrating monthly growth with 0.26% seasonally adjusted increase and remarkable 24.11% annual expansion. This exceptional performance reflects accelerated consumer adoption of electronic books, digital games, and software subscriptions. The sustained growth indicates consumers prioritize digital entertainment and productivity tools even during economic uncertainty.
Sporting goods, hobby, music and book stores recorded 8.52% annual growth despite 0.13% monthly decline. This category's resilience demonstrates consumer commitment to recreational activities and fitness investments. The modest monthly decrease likely reflects seasonal patterns rather than fundamental weakness, as summer outdoor activities typically reduce indoor equipment purchases.
Health and personal care stores maintained steady consumer demand with 3.47% annual growth alongside 0.31% monthly decrease. Essential healthcare products and wellness items continue attracting consistent spending. This category traditionally resists economic downturns as consumers prioritize health-related purchases regardless of broader financial concerns.
General merchandise stores, representing large-format retailers and department stores, achieved 3.18% annual growth with 0.15% monthly decline. These establishments serve as economic indicators due to their broad product mix spanning essential and discretionary categories. The positive annual performance suggests underlying consumer demand remains intact despite monthly volatility.
Grocery and beverage stores demonstrated stability with 2.59% annual growth and minimal 0.13% monthly decrease. Food and beverage purchases represent non-discretionary spending that maintains consistency across economic cycles. The modest growth reflects population increases and gradual price adjustments rather than volume expansion.
Clothing and accessories stores faced headwinds with 2.71% annual growth but 0.22% monthly decline. Apparel purchases often serve as early indicators of consumer discretionary spending changes. The modest annual growth suggests consumers maintain wardrobe investments while exhibiting increased price sensitivity and purchase timing optimization.
Electronics and appliance stores experienced significant monthly pressure with 1.03% decline while maintaining 2.43% annual growth. Major electronics purchases require substantial consumer confidence, making this category particularly sensitive to economic uncertainty. The annual growth indicates sustained demand for technology upgrades and replacement purchases.
Furniture and home furnishings stores encountered the most challenging conditions with 1.04% monthly decrease and 1.14% annual decline. Home furnishing purchases typically require significant financial commitment and stable housing situations. The negative annual performance suggests consumers are postponing major home improvement and decoration projects.
Building and garden supply stores faced severe headwinds with 0.76% monthly decline and substantial 5.33% annual decrease. Home improvement projects require both discretionary income and long-term housing confidence. The significant annual decline indicates consumers are delaying renovation projects and major landscaping investments.
The performance disparity between digital and physical retail categories highlights ongoing consumption pattern evolution. Digital products' exceptional growth contrasts sharply with traditional retail struggles, suggesting permanent behavioral shifts rather than temporary economic responses. Marketing professionals should recognize these divergent trends when allocating advertising budgets across categories.
High-involvement purchase categories including furniture, building supplies, and electronics showed the greatest vulnerability to economic uncertainty. These sectors require substantial consumer confidence and financial planning, making them leading indicators for broader economic sentiment changes. Advertising strategies for these categories should emphasize value propositions and financing options during uncertain periods.
Essential categories including groceries, health products, and clothing maintained relative stability despite monthly fluctuations. These sectors provide consistent advertising opportunities during economic volatility, though competitive intensity may increase as brands compete for stable demand segments.
The data reveals clear patterns distinguishing between recession-resistant and recession-sensitive retail categories. Digital entertainment, health products, and essential goods demonstrate resilience, while big-ticket discretionary items face immediate pressure from consumer caution. Marketing budget allocation should reflect these category-specific risk profiles and growth trajectories.