Banks profit six times their costs as merchants absorb 50% of debit fraud
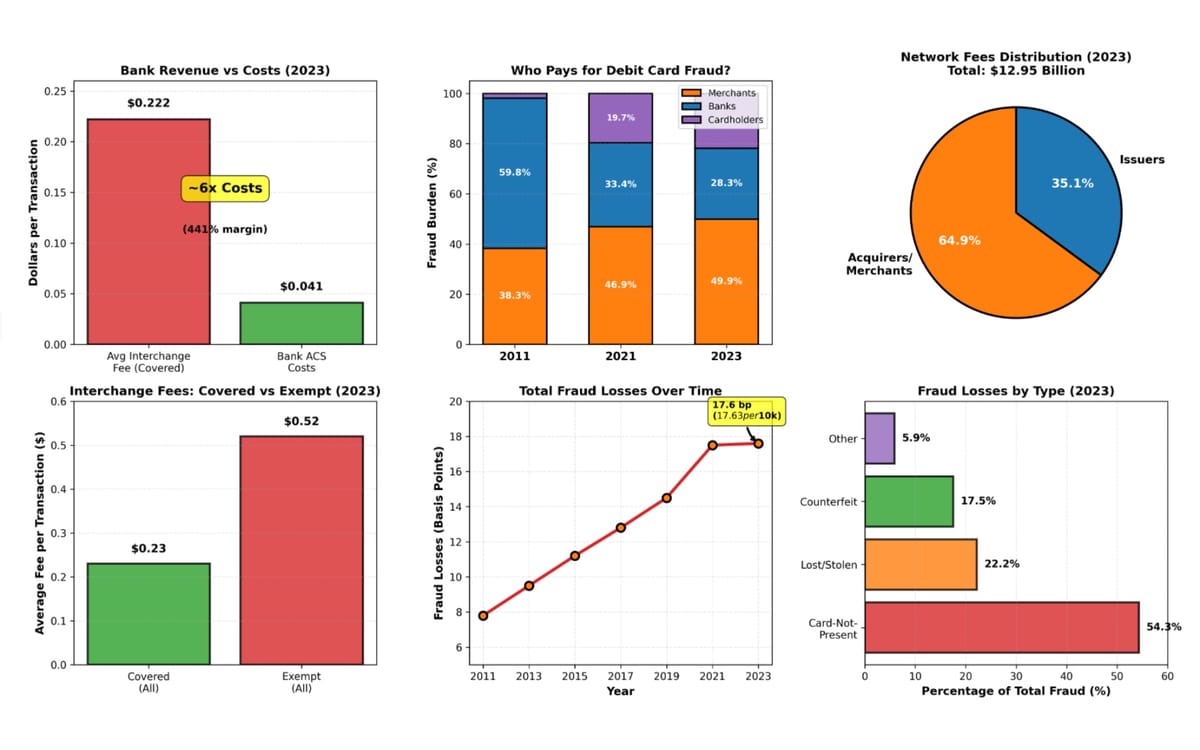
Federal Reserve data shows banks earning $0.24 on $0.041 costs while merchants absorbed 49.9% of debit card fraud in 2023, up from 38.3% in 2011, as industry resists fee updates.
Banks earn 6x costs on debit fees while merchants absorb 50% of fraud losses in 2023.
Banks earn 6x costs on debit fees while merchants absorb 50% of fraud losses in 2023.
The Federal Reserve has published biennial data revealing that large banks continue to generate outsized returns on debit card transactions—approximately six times their processing costs—while simultaneously shifting an increasing burden of fraud losses onto merchants. The December 2025 report exposes a payment system where regulated banks average nearly $0.24 in revenue on costs of just $0.041 per transaction, even as merchants now absorb half of all debit card fraud.
The data, covering 2023 transactions, arrives amid renewed pressure from merchant coalitions demanding the Federal Reserve finalize long-delayed updates to Regulation II, which governs debit card interchange fees. Financial industry associations have requested withdrawal or delay of these updates at least six times since November 2023, most recently in a December 8, 2025 letter that merchant groups characterized as the latest installment in a coordinated stalling campaign.
PPC Land Newsletter
Subscribe PPC Land newsletter ✉️ for similar stories like this one
Merchants paid for 49.9 percent of debit card fraud in 2023, according to the Federal Reserve's analysis of covered issuers—financial institutions with consolidated assets exceeding $10 billion that are subject to interchange fee regulations. That figure represents a substantial increase from 46.9 percent in 2021 and 38.3 percent in 2011, when the Durbin Amendment to the Dodd-Frank Wall Street Reform law first established interchange fee standards.
During the same period, banks' share of fraud losses plummeted from 59.8 percent in 2011 to just 28.3 percent in 2023. The remaining losses fell on cardholders, whose share rose from less than 1.8 percent in 2011 to 21.8 percent in 2023.
Doug Kantor, Executive Committee member of the Merchants Payments Coalition and General Counsel for the National Association of Convenience Stores, stated in a December 22 release that the data demonstrates "the consequences of the Federal Reserve failing to keep up with its job as a regulator." Kantor emphasized that rather than updating regulations, the Fed has allowed Visa and Mastercard to punish merchants with increasing fraud losses while banks extract profits far exceeding their costs.
The fraud shift occurs even as merchants continue paying banks a 0.05 percent fraud-prevention adjustment fee on transaction amounts—a fee structure unchanged since 2011 despite the dramatic reallocation of actual fraud losses. Federal regulations authorize this fee to cover banks' anticipated fraud losses, though the statute passed by Congress does not explicitly permit card networks to shift fraud losses through fee structures.
The Federal Reserve report documents that banks subject to Regulation II earned average per-transaction authorization, clearing, and settlement costs of $0.041 in 2023, excluding fraud losses. When including fraud losses, the typical regulated interchange fee—$0.21 plus 5 basis points multiplied by transaction value, plus an optional $0.01 fraud-prevention adjustment—substantially exceeded actual costs for 80.1 percent of covered issuers representing 99.2 percent of covered transactions.
These economics contrast sharply with typical retail profit margins. Retail profit margins in the United States typically range around 3 percent or less, while bank profit margins average approximately 30 percent. The Federal Reserve data shows bank profit margins on regulated debit interchange fees approaching 500 percent.
Authorization, clearing, and settlement costs have declined consistently since the regulation's implementation. Average per-transaction costs fell from approximately $0.08 in 2009 to $0.041 in 2023—roughly half the 2009 figure. The Board of Governors noted in its November 2023 proposal that "allowable costs incurred by covered issuers have fallen significantly since the original Regulation II rulemaking."
High-volume issuers—those processing more than 100 million transactions annually—achieved the lowest per-transaction costs at $0.036 in 2023. Mid-volume issuers, processing between 1 million and 100 million transactions, averaged $0.121 per transaction. Low-volume covered issuers, those processing fewer than 1 million transactions despite having consolidated assets exceeding $10 billion, averaged $1.088 per transaction.
Advertise on ppc land
Buy ads on PPC Land. PPC Land has standard and native ad formats via major DSPs and ad platforms like Google Ads. Via an auction CPM, you can reach industry professionals.
Payment card networks collected $12.95 billion in fees from all parties in 2023, up from $11.49 billion in 2021. The average network fee per transaction reached $0.129 in 2023, compared to $0.125 in 2021 and $0.098 in 2011.
Acquirers and merchants paid 64.9 percent of total network fees in 2023, up from 63.9 percent in 2021. This figure continues a long-term trend that has seen the merchant and acquirer share of network fees increase gradually from 44.3 percent in 2009.
Total interchange fees across all debit and general-use prepaid card transactions reached $34.12 billion in 2023, representing an average increase of 3.9 percent per year since 2021. For transactions covered by Regulation II, average interchange fees have remained relatively stable since the regulation took effect in the fourth quarter of 2011, at $0.24 for single-message network transactions and $0.22 for dual-message network transactions in 2023.
Average interchange fees for transactions exempt from Regulation II stood at $0.52 in 2023. For exempt transactions processed over dual-message networks—which traditionally processed signature-authenticated transactions—the average interchange fee declined slightly from $0.64 in 2021 to $0.62 in 2023, marking the first reversal of an upward trend that had seen this figure increase from $0.51 in the fourth quarter of 2011.
Transaction volume growth decelerates
Payment card networks in the United States processed 100.7 billion debit and general-use prepaid card transactions valued at $4.7 trillion in 2023. Total transaction volume and value both grew at an average rate of 4.6 percent per year from 2021 to 2023, significantly slower than the average annual growth rates from 2009 to 2021, which were 7.8 percent by volume and 9.5 percent by value.
Dual-message networks accounted for 71.4 percent of transaction volume and 72.9 percent of transaction value in 2023. Single-message networks, which traditionally processed PIN-authenticated transactions, accounted for the remainder. The dual-message share has increased 9.0 percentage points since 2009.
Card-not-present transactions reached 34.4 percent of total volume and nearly half of total value in 2023. From 2021 to 2023, card-not-present transaction volume grew 8.2 percent per year, faster than the 2.8 percent per year growth for card-present transactions but considerably slower than the 26.5 percent per year growth observed from 2019 to 2021 during the COVID-19 pandemic.
Prepaid card transactions recorded the highest growth rate among all transaction categories from 2022 to 2023, increasing 19.7 percent. This marked the first time since 2015 that prepaid card transactions grew faster than card-not-present transactions.
Fraud losses across all transactions for covered issuers reached 17.6 basis points as a share of transaction value in 2023, or $17.63 per $10,000 in transaction value. This figure reflects a steady increase from 7.8 basis points in 2011.
Prepaid transactions experienced the highest fraud levels, with fraud losses representing 312.6 basis points of transaction value and fraudulent transactions accounting for 1.12 percent of all prepaid transactions. Dual-message transactions showed fraud losses of 17.9 basis points and a fraud incidence of 0.12 percent. Single-message transactions maintained the lowest fraud levels at 6.7 basis points and 0.03 percent incidence, consistent with patterns observed since 2011.
Card-not-present fraud accounted for 54.3 percent of overall fraud in 2023, making it the largest fraud category. Lost and stolen fraud represented 22.2 percent of total fraud, while counterfeit fraud accounted for 17.5 percent. Other fraud types constituted the remaining 5.9 percent.
The composition of fraud losses varied substantially by transaction category. Card-not-present fraud drove the majority of dual-message transaction fraud at over two-thirds of total losses. Lost and stolen fraud made up 72.9 percent of prepaid fraud losses. For single-message transactions, card-not-present, lost and stolen, and counterfeit fraud each accounted for roughly equal shares.
On July 1, 2023, the final revision to Regulation II specifying that routing provisions apply to card-not-present transactions went into effect. While single-message networks remained relatively rarely used for card-not-present transactions in 2023, a modest increase in usage was observed. The share of single-message card-not-present transactions increased from 6.1 percent of volume and 4.5 percent of value in 2021 to 6.6 percent of volume and 5.0 percent of value in 2023.
Industry resistance to regulatory updates
The December 17, 2025 letter from merchant trade associations directly addresses what they characterize as persistent financial industry delay tactics. The letter notes that financial trade associations have publicly advocated for delaying or withdrawing the Board's proposed Regulation II update at least six times since November 2023, each time with varying rationales but consistent objectives.
The merchant coalitions—including the National Retail Federation, FMI-The Food Industry Association, National Association of Convenience Stores, and National Restaurant Association—emphasized that allowable costs have declined significantly since 2009, yet the regulated rate has not been updated to reflect this decline. They rejected industry arguments that the Board should wait for newer data, characterizing this as a transparent strategy where financial institutions advocate for delay and then argue that too much time has passed for the data to remain current.
The December 8, 2025 financial industry letter urged the Board to refrain from moving forward until there is "legal certainty" regarding Regulation II litigation in the Corner Post and Linney's Pizza cases. Merchant groups countered that these cases already provide sufficient clarity. The Corner Post court specifically stated its order "does not prevent the Board's updates to Regulation II from taking effect, which serve to lower the interchange fee cap based on the latest data." The Linney's Pizza court upheld the Board's 2011 determination of allowable costs, which merchant groups argue does not forestall the 2023 proposal since it simply updates rates to reflect decreased costs without changing which costs are allowable.
Financial industry representatives have consistently argued that banks that dislike regulated interchange amounts can set their own fee rates rather than following fee schedules fixed by Visa and Mastercard. However, according to merchant coalition statements, not a single bank subject to the regulation has been willing to exit the price-fixed debit fee scheme to set competitive rates.
The merchant letter emphasized the urgency of fee relief at a time when affordability and rising prices represent critical concerns for American consumers. Each day of regulatory delay, the coalitions argued, means another day of excessively high fees that accrue to large banks but are ultimately borne by Main Street merchants and their customers.
Regulatory framework and compliance patterns
The Dodd-Frank Wall Street Reform Act requires the Federal Reserve Board to prescribe rules related to debit card interchange fees and routing. The Board's Regulation II implements these statutory provisions and requires the Board to disclose aggregate information concerning costs incurred and interchange fees charged by issuers and payment card networks on at least a biennial basis.
The statute establishes that interchange fees must be "reasonable and proportional" to the cost of the transaction to the bank issuing the debit card. The law allows banks willing to set their own fees in a competitive market to charge any amounts they determine appropriate, but this provision has seen no practical application since the regulation took effect.
Federal regulations authorize an interchange fee standard of $0.21 plus 5 basis points multiplied by transaction value, plus an optional $0.01 fraud-prevention adjustment for issuers meeting fraud-prevention standards. In 2023, only 26.3 percent of covered issuers had fraud-prevention costs below the $0.01 threshold, representing just 10.6 percent of covered transactions—down substantially from 42.0 percent of issuers and 34.5 percent of transactions in 2021.
The Federal Reserve's data collection encompasses 166 covered issuers in 2023, compared to 162 in 2021. High-volume issuers—34.1 percent of respondents—accounted for 94.0 percent of transaction volume and 93.9 percent of transaction value. Mid-volume issuers represented 53.9 percent of respondents but just 5.9 percent of volume and 6.1 percent of value. Low-volume issuers constituted 12.0 percent of respondents but only 0.01 percent of volume and value.
Payment network concentration continues
Payment card networks processed total debit and prepaid transactions representing average values of $46.26 per transaction in 2023. Dual-message transactions averaged $47.29, while single-message transactions averaged $43.71. Prepaid transactions averaged $36.86.
Card-not-present transactions maintained substantially higher average values than card-present transactions—$63.96 compared to $36.99 in 2023. However, the premium for card-not-present transactions has narrowed over time as e-commerce has expanded to include smaller-value purchases. In 2009, card-not-present transactions averaged 2.3 times the value of card-present transactions, compared to 1.7 times in 2023.
Network fees paid by issuers varied substantially between covered and exempt institutions. Exempt issuers paid $0.096 per transaction to dual-message networks in 2023, compared to $0.019 for covered issuers. For single-message networks, exempt issuers paid $0.046 per transaction while covered issuers paid $0.008.
Payments and incentives received by issuers from networks also differed significantly. Covered issuers received payments equal to 74.7 percent of network fees paid to dual-message networks and 13.6 percent of fees paid to single-message networks. Exempt issuers received payments equal to 40.0 percent of dual-message network fees and 20.4 percent of single-message network fees.
The data demonstrates a payment card ecosystem where large financial institutions maintain substantial profit margins on regulated transactions, card networks extract increasing fees from all participants, and merchants absorb growing shares of both network costs and fraud losses—all while transaction processing costs for covered issuers have declined by roughly half since the regulation's initial implementation.
PPC Land Newsletter
Subscribe PPC Land newsletter ✉️ for similar stories like this one
Who: The Federal Reserve Board, covered issuers (banks with assets exceeding $10 billion), payment card networks Visa and Mastercard, merchant coalitions including the National Retail Federation and National Association of Convenience Stores, and financial industry trade associations including the American Bankers Association.
What: A Federal Reserve biennial report documenting 2023 debit card transaction data shows banks earning nearly six times their processing costs ($0.24 revenue on $0.041 costs) while merchants absorbed 49.9 percent of fraud losses, up from 38.3 percent in 2011, as financial institutions repeatedly request delays to proposed interchange fee regulation updates.
When: The report was published in December 2025, covering 2023 transaction data. The regulatory dispute spans from November 2023 when the Federal Reserve proposed updates through December 2025 when merchant coalitions responded to the sixth industry delay request.
Where: The data covers United States payment card networks processing 100.7 billion transactions valued at $4.7 trillion, with covered issuers ranging from the largest debit card issuers to smaller programs with consolidated assets exceeding $10 billion.
Why: The Dodd-Frank Wall Street Reform Act's Durbin Amendment requires the Federal Reserve to regulate debit card interchange fees to ensure they are "reasonable and proportional" to issuer costs, and to publish biennial data on costs and fees. Merchant coalitions seek updated regulations reflecting declined processing costs since 2009, while financial institutions advocate for delay, maintaining current fee structures that generate substantial profit margins despite falling costs and shifting fraud liability.
Share this article
The link has been copied!
Your link has expired. Please request a new one.
Your link has expired. Please request a new one.
Your link has expired. Please request a new one.
Great! You've successfully signed up.
Great! You've successfully signed up.
Welcome back! You've successfully signed in.
Success! You now have access to additional content.