Experienced Claude users succeed 10% more - and the gap is widening
Anthropic's March 2026 Economic Index finds users with 6+ months on Claude achieve a 10% higher task success rate, while AI adoption splits along skill lines globally.

Anthropic's March 2026 Economic Index finds users with 6+ months on Claude achieve a 10% higher task success rate, while AI adoption splits along skill lines globally.
Anthropic published its fifth Economic Index report on March 24, 2026, drawing on a sample of 1 million conversations from Claude.ai and its first-party API between February 5 and February 12, 2026. The findings trace how usage patterns have shifted since the previous report - which used data from November 2025 - and introduce, for the first time, a systematic analysis of how tenure shapes what users get out of the platform. The headline result is striking: people who have been using Claude for six months or longer succeed in their conversations at a measurably higher rate than newer users. That gap persists even after controlling for the type of task, the model selected, the country of origin, and the specific use case.
The Anthropic Economic Index uses a privacy-preserving analysis system that classifies conversations at an aggregated level without accessing the contents of individual transcripts. According to the report, sampling covers both Claude.ai - the consumer-facing web interface - and the first-party API, described as "the developer-facing interface for integrating Claude into products and workflows." That first-party channel is distinct from third-party deployments on platforms such as Amazon Bedrock or Google Cloud Vertex. The sample period, February 5 to February 12, fell three months after the release of Claude Opus 4.5 and coincided with the release of Claude Opus 4.6.
The researchers - Maxim Massenkoff, Eva Lyubich, and Peter McCrory as lead authors, alongside Ruth Appel and Ryan Heller - map conversations to the O*NET occupational classification framework. This allows the report to assign an approximate dollar value to each task based on the median US hourly wage paid to workers in the associated occupation, using May 2024 Bureau of Labor Statistics data.
One of the clearest findings is that Claude.ai usage became less concentrated between November 2025 and February 2026. According to the report, the top 10 most common O*NET tasks fell from 24% of all Claude.ai conversations to 19% over that period. That is a meaningful drop in a relatively short time frame.
The diversification reflects two distinct forces. First, coding tasks continued shifting out of Claude.ai and into the API, where Claude Code has grown substantially. According to the report, Claude Code's agentic architecture "splits coding work into smaller API calls, which are labeled as distinct tasks," distributing coding-related traffic across many categories rather than concentrating it in a few. Since August 2025, the share of Computer and Mathematical tasks increased by 14% in the API while declining by 18% in Claude.ai.
Second, the user base itself changed. Coursework conversations fell from 19% to 12% of Claude.ai traffic, partly because the sampling window overlapped with winter academic breaks in several major countries - the report notes that the drop in coursework was 5 percentage points in countries where school terms were active and 12 percentage points in countries where students were on break. Meanwhile, personal use rose from 35% to 42%, driven by increasing sign-ups of more casual users. Anthropic's Super Bowl advertising campaign during the same period brought many first-time users to the platform.
The economic value of tasks on Claude.ai, measured as the average hourly wage of the occupations involved, slipped from $49.3 per hour in January 2025 to $47.9 per hour in February 2026. That figure remains well above the US average hourly wage of $37.3. The report attributes the decline mainly to growth in simple factual queries - sports outcomes, weather, product comparisons - rather than any structural retreat from high-value work. On the API side, the average task value has risen consistently, reaching $50.7 per hour in February 2026.
Supporting these directional shifts, several quantitative primitives changed between November 2025 and February 2026. The average years of education required to understand human inputs fell from 12.21 to 11.92. AI autonomy, measured on a 1-to-5 scale, edged up from 3.38 to 3.41. The estimated time a human would spend on the task without AI fell by roughly 2 minutes, reaching 183.77 minutes. Combined human and AI time also declined, dropping from 15.35 to 14.30 minutes.
The report highlights two API workflow categories whose shares at least doubled between November 2025 and February 2026. According to the report, these emerging patterns were identified by filtering for O*NET tasks appearing at least 300 times in the data and showing at least 2x growth compared to the previous sample.
The first is business sales and outreach automation - encompassing sales enablement generation, B2B lead qualification research, customer data enrichment, and cold-email drafting. The second is automated trading and market operations - monitoring market positions, proposing specific investments, informing traders of market conditions. Both represent categories in which a human is largely absent from individual interactions, a pattern the report associates with more imminent labor market exposure for the associated occupations.
According to the report, automation decreased sharply in the first-party API data during the same period - a finding that initially seems contradictory but reflects a shift in how workflows are classified. Augmentation, defined as collaborative interaction where the AI complements the user rather than operating autonomously, increased slightly on Claude.ai, reaching 53% of conversations in February 2026 compared to 52% in November 2025.
A persistent theme across all five Economic Index reports has been geographic concentration. According to the February 2026 data, the top 20 countries by per-capita usage accounted for 48% of all usage adjusted for population - up from 45% in November 2025. The Gini coefficient for cross-country usage rose over the same period, indicating that the gap between high-adoption and low-adoption countries widened slightly.
Within the United States, the picture is different. States with lower per-capita usage continued converging toward the national mean, though at a slower pace than in earlier reports. The share of per-person usage accounted for by the top five states fell from 30% to 24% between August 2025 and February 2026. However, the researchers revised their earlier projections: at the current pace, US states would reach roughly equal per-capita Claude usage in five to nine years, rather than the two-to-five-year estimate published previously.
About 49% of jobs have now seen at least a quarter of their tasks performed using Claude - a figure that barely changed from the previous report, suggesting that the breadth of occupational exposure has stabilized even as depth varies considerably.
One of the report's two analytical chapters examines how users distribute their work across Claude's three model classes: Haiku, Sonnet, and Opus. The Opus class uses the most tokens and is priced at a premium on the API, but offers the strongest performance on complex tasks. If users are calibrating rationally, Opus should appear more often on harder, higher-wage work.
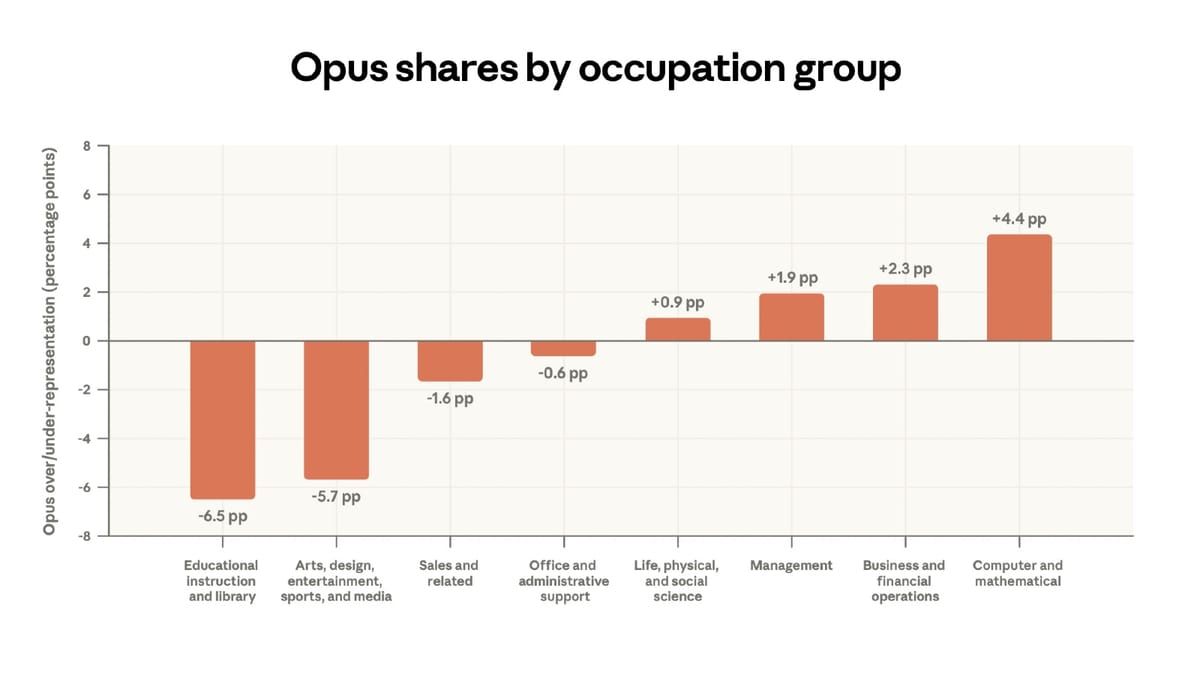
That is broadly what the data shows. According to the report, 51% of overall usage on paid Claude.ai accounts involves Opus. Among Computer and Mathematical tasks - which include software development - that figure rises to 55%, representing a 4.4 percentage point overrepresentation relative to the average. Educational tasks, by contrast, see Opus used at a rate 6.5 percentage points below average.
The relationship is roughly linear. On Claude.ai, for every additional $10 per hour in occupational wage associated with a task, the share of conversations using Opus increases by 1.5 percentage points. That slope is about twice as steep for first-party API users, at 2.8 percentage points per $10, reflecting that developers deploying programmatic workflows have stronger incentives to switch between models based on task demands and cost constraints.
At the individual occupation level, 34% of Software Developer tasks on Claude.ai involve Opus, compared to 12% of Tutor tasks. Chief executives show a similarly high Opus share.
The report's second analytical chapter addresses the central question directly: do people get better at using Claude over time? The answer, according to the data, is yes - though with important caveats about causation.
The researchers define high-tenure users as those who signed up for Claude at least six months before the data pull. On the raw comparison, high-tenure users are 7 percentage points more likely to be using Claude for work rather than personal reasons. Their inputs reflect a higher average education level - 12.3 years compared to 11.5 for low-tenure users. Their task success rate, as measured by Claude's own assessment of whether a conversation achieved its goal, is 73.1%, compared to 66.7% for low-tenure users. That is a 6.4 percentage point gap.
The gap in success rates narrows somewhat when the analysis controls for task type. According to the report, including fixed effects for specific O*NET tasks and request clusters - essentially comparing high- and low-tenure users doing the same task - brings the estimated difference down to approximately 3 percentage points. Adding controls for model choice, use case, country, and language yields an estimate of about 4 percentage points.
According to the report, "these results suggest that high-tenure users have more success in their Claude conversations, and that this is not due to simple factors like language or the task being performed." The researchers describe this as consistent with "learning-by-doing" - users improving their ability to extract useful responses through accumulated experience.
What does that look like in practice? High-tenure users are 8.7 percentage points less likely to use a directive interaction style - essentially handing off a complete task with an instruction like "write this email" or "summarize this report." They are 3.6 percentage points more likely to use task iteration, meaning they build on model outputs rather than accepting them wholesale. They are also 3.4 percentage points more likely to engage in learning mode. Peter McCrory, Head of Economics at Anthropic and one of the report's lead authors, commented on LinkedIn that the shift reflects a different cognitive relationship with the model: "someone who comes in treating it like a google search bar gets very different results six months later once they've internalized that this is a different paradigm entirely."
The tasks with the highest average user tenure - reflecting that experienced users gravitate toward them - include AI research, git operations, manuscript revision, and startup fundraising. The tasks with the lowest average tenure include writing haikus, checking sports scores, and suggesting food for parties. The gap illustrates how the platform's user base has layered over time, with technically sophisticated early adopters still concentrated at the high-value end.
The researchers are careful about what the learning curve findings do and do not prove. Two alternative explanations cannot be ruled out with available data. First, cohort effects: early adopters may simply be more technical people - software developers, researchers, financial analysts - whose success rates reflect pre-existing skills rather than anything they learned on the platform. Second, survivorship bias: users who signed up a year ago and are still active may be the ones for whom Claude works well, with unsuccessful users having churned out of the sample unobserved.
The controlled regressions partially address these concerns by ruling out simple compositional differences in task type. But the researchers acknowledge that cleanly isolating learning-by-doing from cohort and survivorship effects will require longitudinal data over a longer horizon.
The advertising and marketing sector is among the most active adopters of Claude across enterprise use cases. PPC Land has tracked how AI-driven automation is reshaping professional workflows, including a 2025 DoubleVerify study finding that marketers spend more than 10 hours weekly on routine campaign tasks. The Anthropic report's emergence of business sales and outreach automation as a fast-growing API workflow category - including B2B lead qualification, customer data enrichment, and cold-email drafting - maps directly onto common marketing operations.
The finding that API task concentration is rising (top 10 tasks now account for 33% of API traffic, up from 28% since August 2025) suggests developers are standardizing around a core set of high-frequency use cases. For advertising technology companies building on the API, this concentration provides clearer signal about where investment in prompt engineering and workflow design pays off.
The skill-gap finding carries longer-term implications. If experienced users consistently extract more value from AI tools, organisations that train and retain AI-proficient staff - and give them time to build habits through use - will compound an advantage over those treating AI as a drop-in tool requiring no skill development. Anthropic's own Academy has expanded enterprise training courses through partnerships with AWS, Google Cloud, and Deloitte - a direct response to the professional skills gap the Economic Index describes.
The equity dimension is also relevant for global advertisers. According to the report, the gap in per-capita AI usage between high-adoption and low-adoption countries is widening, not narrowing. For international marketing teams, this creates asymmetric competitive conditions: teams in high-adoption markets may be building AI proficiency faster, with compounding effects on campaign efficiency.
The report's data on automated trading and market operations doubling as an API workflow category also flags an emerging risk for the programmatic advertising ecosystem. Automated financial decision-making that operates without a human in the loop shares structural characteristics with fully automated programmatic buying - and the same questions about accountability, error propagation, and exposure to manipulation apply.
Who: Anthropic, through its Economics team led by Maxim Massenkoff, Eva Lyubich, and Peter McCrory, with contributions from Ruth Appel and Ryan Heller.
What: The fifth Anthropic Economic Index report, titled "Learning curves," analyzing 1 million Claude conversations from February 5 to February 12, 2026. Key findings include: users with six or more months on the platform succeed at tasks at a 10% higher rate than newer users; Claude.ai usage diversified while API usage concentrated further around coding and automation tasks; global inequality in AI adoption widened; and users demonstrably select more powerful models for higher-value work.
When: The report was published on March 24, 2026. The data covers a one-week window in February 2026, three months after the previous report used November 2025 data.
Where: The analysis covers usage across Claude.ai and Anthropic's first-party API globally, with geographic breakdowns at the US state and country level. The report is publicly available at anthropic.com and underlying data is accessible via Hugging Face.
Why: Anthropic frames the Economic Index as an effort to give researchers and policymakers early visibility into how AI is reshaping work, before the effects become entrenched. The learning curve finding raises a specific policy concern: if AI proficiency compounds with experience and remains concentrated among high-skill, high-income users, the technology may reinforce rather than reduce labor market inequality - a dynamic the report connects to the established economics literature on skill-biased technological change.