Google Analytics introduces annotations feature to enhance data context
New functionality allows teams to document data fluctuations and campaign impacts directly within reports.

New functionality allows teams to document data fluctuations and campaign impacts directly within reports.
Google Analytics has unveiled a new annotations feature for its Google Analytics 4 (GA4) platform, marking a significant enhancement to its reporting capabilities. The feature, announced on March 20, 2025, just seven days ago, enables users to add contextual notes directly to line graphs within reports, addressing a long-standing need for better documentation of data anomalies and marketing activities.
This addition represents a substantial improvement to Google Analytics' functionality, particularly for teams that collaborate on data analysis and require shared context for interpreting metrics. The introduction of annotations arrives alongside several other updates to the platform that collectively enhance data visualization and interpretation.
According to Google's official documentation, the annotations feature "allows users to add notes directly to Google Analytics 4 reports, making it easier to record events, explain changes in data, or highlight key observations for yourself and your team." This capability addresses a common challenge faced by analytics professionals who need to maintain institutional knowledge about data fluctuations.
The new feature manifests as interactive icons placed along the timeline of line graphs within Google Analytics reports. When annotations are created, they appear visibly across all reports that display line graphs, ensuring consistency of context throughout the analytics environment. This cross-report visibility makes annotations particularly valuable for documenting platform-wide impacts such as tracking changes or website updates.
Implementation of the annotation feature requires specific permission levels within the platform. Users must possess Editor or above access at the property level to create and edit annotations, while those with Viewer access can see but not modify annotations. This permission structure ensures appropriate governance of contextual information while maintaining broad visibility.
Each Google Analytics property has a technical limitation of 1,000 annotations, which should accommodate the documentation needs of most organizations while preventing excessive clutter in reports. This threshold reflects a balance between comprehensive documentation and maintaining report clarity.
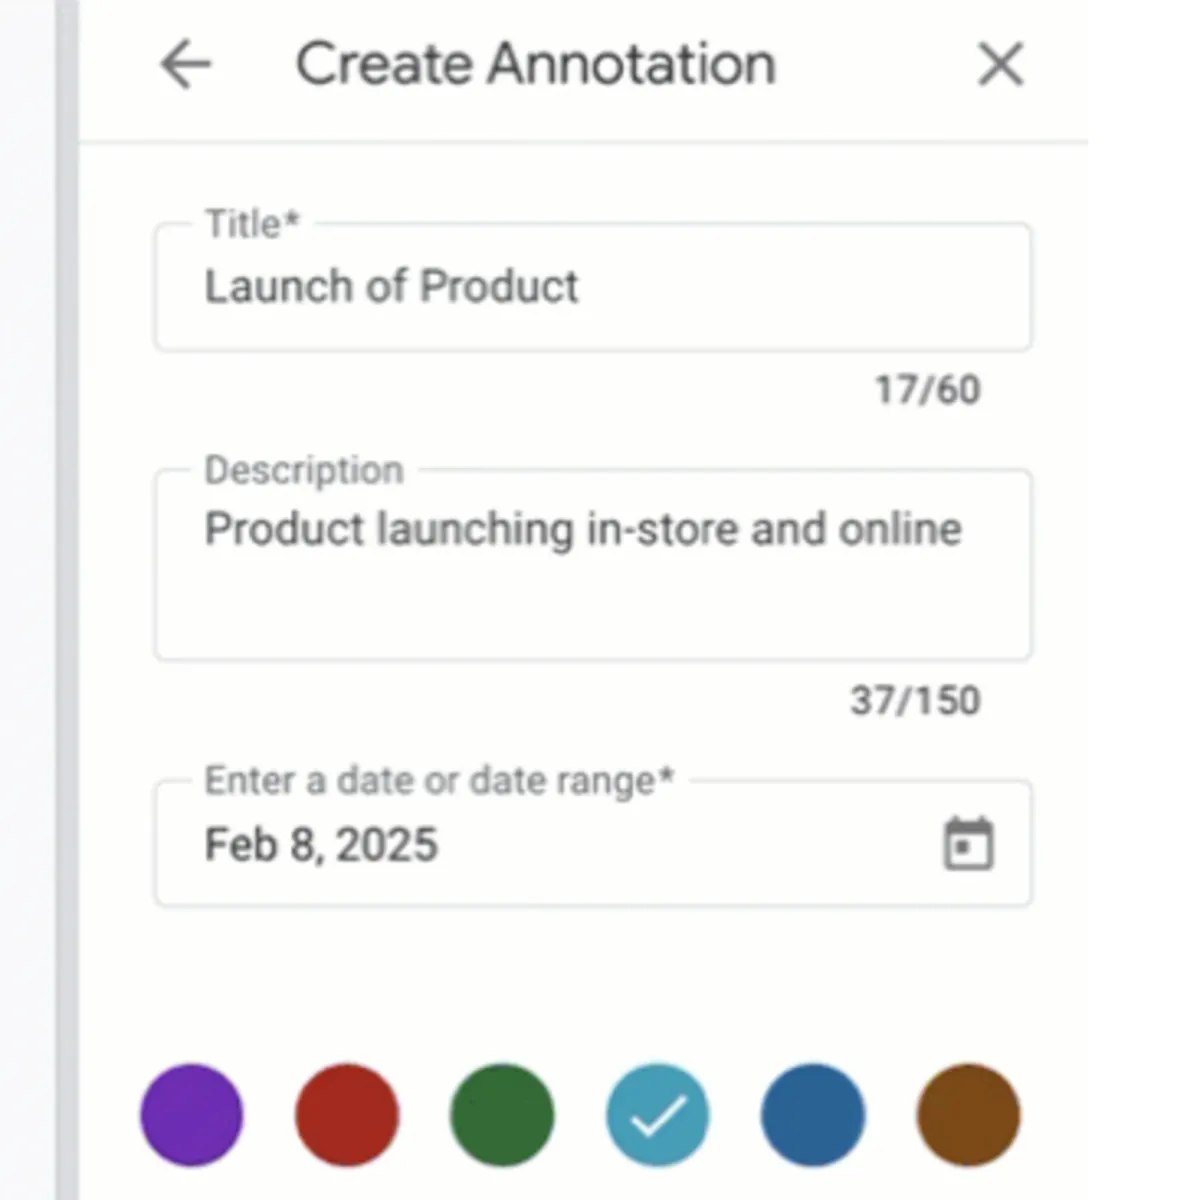
The process for adding annotations has been streamlined to integrate with normal analytics workflows. According to the documentation, users can create annotations by following a straightforward process that begins with right-clicking on any data point within a line graph in Google Analytics reports.
The annotation creation process includes several components designed to make the contextual information clear and useful:
This structured approach to annotation creation ensures consistency in documentation while providing sufficient flexibility to address various use cases. The color coding functionality, in particular, enables visual categorization that can help teams quickly identify different types of annotations, such as marketing campaigns versus technical issues.
The platform includes provisions for managing annotation visibility as well. Users can temporarily hide annotations through settings in the "Annotations Viewer" panel, which allows for cleaner report viewing when necessary while maintaining the ability to quickly restore the context when needed.
For organizations anticipating numerous annotations with overlapping timeframes, Google recommends creating single-date annotations rather than date ranges. This approach prevents visual clutter while still providing the necessary documentation of events affecting analytics data.
Beyond user-created annotations, Google has implemented system-generated annotations that automatically document significant data-impacting events. According to the documentation, "When a significant data-impacting event occurs, Google Analytics may create an annotation to notify users about the issue on the relevant date and data."
These system annotations follow a similar visual format to user-created annotations but cannot be edited or deleted. The approach represents an automated safeguard to ensure awareness of technical issues that might affect data interpretation, such as tracking outages or processing anomalies.
The combination of user-defined and system-generated annotations creates a comprehensive documentation environment that addresses both planned activities and unexpected technical issues. This dual approach helps ensure that all factors potentially affecting data are visible to analysts using the platform.
The annotations feature arrives as part of a broader set of updates to Google Analytics that collectively enhance data interpretation. The March release includes annotations alongside other features announced on March 12, including percentage values in report tables and new notification systems for missing data or high rates of undefined values.
These complementary features work together to provide more context and guidance for data interpretation. The percentage values added to detailed reports help users understand the relative significance of each data row, while the notification systems highlight potential data quality issues.
Both of these supplementary features align with the core purpose of annotations by providing additional context for accurate data interpretation. The notifications specifically address technical issues that might require documentation through the annotations feature, creating a cohesive approach to data quality management.
Prior to these March updates, Google had already introduced several other enhancements to Google Analytics this year. On February 3, the company updated cost data import requirements to simplify the process of importing advertising cost information. On January 21, they added the ability to copy reports and explorations across properties, and on January 13, they introduced a centralized consent settings hub.
These sequential updates demonstrate Google's continuous development of the Analytics platform, with annotations representing the latest in a series of enhancements focused on data management, interpretation, and compliance.
The annotations feature addresses several common analytics challenges that organizations face when interpreting historical data. According to the documentation, annotations can be used to "identify and explain spikes or dips in traffic, marketing campaign launches, product launches, and more."
This versatility makes annotations valuable across numerous business scenarios:
The ability to document these events directly within the platform where data is analyzed eliminates the need for separate documentation systems and reduces the risk of context loss when interpreting historical trends.
For organizations that require programmatic creation of annotations, Google has also made the feature available through the Admin API. This capability enables automated annotation creation, which could be particularly valuable for integrating with other systems like deployment tools or marketing automation platforms.
The technical implementation of annotations builds upon the existing Google Analytics interface by adding new interaction points within reports. Users access annotation functionality by right-clicking on data points within line graphs, which reveals an "Add annotation" option in the contextual menu.
Once created, annotations can be accessed and managed through multiple pathways. Users can hover over annotation icons directly in reports to view details via hover cards, click the icons to open a dedicated "Annotations Viewer" panel, or access a comprehensive list of all annotations through the Admin section under "Data display."
The Admin interface provides a centralized location for managing all annotations associated with a property. Depending on user permissions, this interface enables creation, editing, deletion, and export of annotations, making it a valuable tool for annotation governance.
Although Google has not explicitly outlined future developments for the annotations feature, the implementation suggests several potential directions for evolution. The current 1,000 annotation limit per property might eventually be expanded for enterprise users with more complex documentation needs.
Integration with other Google Analytics features, such as explorations and custom reports, represents another logical development path. The current implementation focuses on standard reports with line graphs, but extending annotations to other visualization types would enhance contextual documentation throughout the platform.
The introduction of annotations also raises possibilities for enhanced collaboration features within Google Analytics. While current functionality focuses on documentation, future iterations might include notification systems for new annotations or threading capabilities for discussion around specific data points.
The addition of annotations brings Google Analytics closer to feature parity with other analytics platforms that have long offered similar functionality. This enhancement addresses a specific pain point that had led some organizations to maintain separate documentation systems alongside their analytics implementation.
For organizations that rely heavily on Google Analytics for business decision-making, the annotations feature represents a significant improvement in data governance and institutional knowledge management. The ability to maintain context directly within the analytics platform reduces the risk of misinterpretation and improves the efficiency of data analysis processes.
The annotations feature represents the latest step in Google's ongoing development of Analytics capabilities, with a focus on enhancing data context, visualization, and interpretation. Its integration throughout the reporting interface demonstrates a commitment to improved data governance and collaborative analysis.