Google releases waterfall chart documentation for Looker Studio
Google unveils detailed waterfall chart implementation guide and Looker connector updates for business intelligence users.

Google announced comprehensive documentation for waterfall chart functionality in Looker Studio, marking significant improvements to the business intelligence platform's visualization capabilities. The announcement came alongside the general availability of enhanced Looker connector features on August 7, 2025.
Subscribe the PPC Land newsletter ✉️ for similar stories like this one. Receive the news every day in your inbox. Free of ads. 10 USD per year.
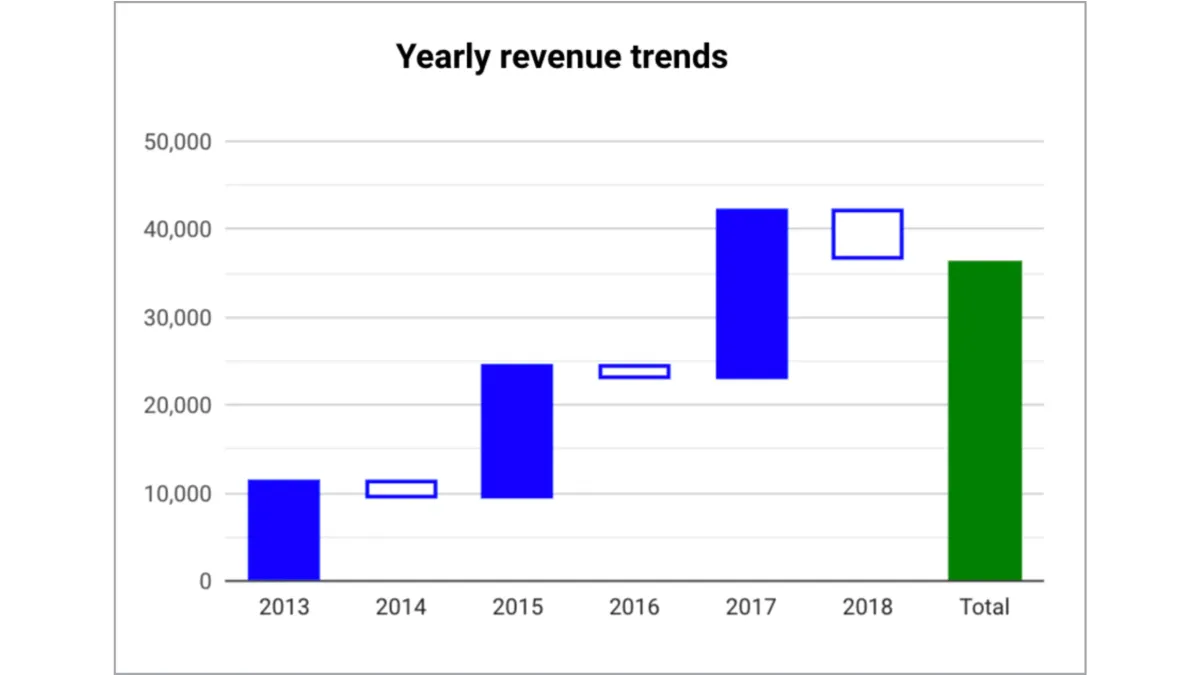
According to the release documentation, waterfall charts enable users to "visualize how a sequence of positive and negative values adds up to a total." These charts prove particularly valuable for financial data analysis, demonstrating how various profits and losses contribute to overall totals. The visualization tool extends beyond financial applications to illustrate how different categories impact aggregate metrics, especially when data contains both positive and negative values.The waterfall chart implementation in Looker Studio supports financial analysis through tracking revenue gains and losses across time periods, enabling businesses to understand sequential value changes within their data. The technical architecture requires one dimension and one metric, providing flexibility for various analytical scenarios beyond financial reporting.
The chart configuration includes essential features such as drill-down capabilities for exploring additional detail levels. Users can specify totals display options including annual, quarterly, and monthly subtotals. Custom aggregation settings allow baseline value specification for waterfall calculations.
The styling options encompass comprehensive visual controls. Data label positioning options provide inside or outside placement relative to bars. Rising bar styling controls cover color configuration for positive values, including fill colors, stroke colors, and stroke weight settings. Conversely, falling bar styling manages negative value appearance through similar color and weight parameters.
Technical implementation details demonstrate robust axis customization capabilities. Users can configure Y-axis parameters including minimum and maximum values, custom tick intervals, and logarithmic scaling. X-axis controls offer similar functionality with rotation settings for label readability improvement.
PPC Land previously reported on Looker Studio's modernization efforts, highlighting how enhanced visualization capabilities support sophisticated data presentation requirements across business intelligence workflows.
The August 7 announcement accompanies other significant platform improvements. Conditional formatting functionality now extends to query result chips, enabling background and text color modifications based on data values. Report creators gain enhanced control over data label presentations in waterfall charts through position specification and text contrast adjustments.
The enhanced Looker connector capabilities achieve general availability status, expanding calculated field functionality. Previously limited to preview access, these features enable users to create complex data transformations without extensive technical knowledge.
New Search Ads 360 connector enhancements introduce custom column and dimension support. According to the documentation, advertisers can now integrate saved custom columns and dimensions from Search Ads 360 directly into Looker Studio reports, joining them with other data fields in comprehensive visualizations.
Grid customization options provide granular control over chart appearance. Users can adjust grid colors, axis colors, font families, and axis font sizes to match organizational branding requirements. Background and border controls enable opacity adjustments, border radius settings, and shadow effects for professional presentation standards.
Recent developments in Looker Studio include Code Interpreter functionality for advanced Python-based analysis, demonstrating Google's commitment to expanding analytical capabilities beyond traditional business intelligence approaches.
The platform's AI integration through Gemini enables natural language interactions for report creation and data analysis. These features complement the waterfall chart documentation by providing automated assistance for complex visualization scenarios.
Chart header functionality includes export options, drill-up and drill-down capabilities, and sorting controls. The header appearance settings range from always visible to hover-activated, accommodating different user interface preferences and presentation requirements.
The requirements specification mandates Looker-hosted instances for connector functionality. IP allowlist configurations may require additional setup for certain deployment scenarios. Version requirements vary by hosting provider, with AWS and Azure requiring Looker version 23.4 minimum, while Google Cloud installations need version 22.16 or later.
Filter enhancement capabilities extend beyond basic functionality. The platform now supports "Matches (advanced)" filter conditions for date and time dimensions, enabling sophisticated temporal analysis. Filter-only fields can function as report controls and quick filters, expanding interactive dashboard capabilities.
Data source limitations include 5-minute query timeouts and 5,000-row result restrictions. Downloads and exports face similar row limitations, impacting large-scale data analysis scenarios. These constraints reflect the platform's focus on interactive visualization rather than comprehensive data extraction.
The documentation update addresses business intelligence professionals seeking advanced visualization capabilities. Waterfall charts prove particularly valuable for financial reporting, project management tracking, and sequential process analysis across industries.
Subscribe the PPC Land newsletter ✉️ for similar stories like this one. Receive the news every day in your inbox. Free of ads. 10 USD per year.
Looker Studio Google's business intelligence platform serves as the central hub for data visualization and reporting across enterprise environments. The platform enables organizations to transform raw data into actionable insights through interactive dashboards and comprehensive reporting tools. Looker Studio's architecture supports both basic visualization needs and advanced analytical requirements, positioning it as a competitive alternative to established business intelligence solutions. The platform's integration with Google Cloud services provides seamless connectivity to various data sources while maintaining security protocols essential for enterprise deployments.
Waterfall Charts These specialized visualization tools demonstrate sequential changes in values through connected bars representing positive and negative contributions to a final total. Waterfall charts excel in financial analysis scenarios where understanding individual components' impact on overall performance becomes critical. The visualization technique proves valuable beyond financial contexts, extending to project management tracking, inventory analysis, and any scenario requiring step-by-step value progression understanding. Technical implementation requires one dimension and one metric, enabling flexible application across diverse analytical requirements while maintaining visual clarity through color-coded positive and negative value representations.
Data Visualization The systematic transformation of numerical data into graphical representations enables users to identify patterns, trends, and insights that remain hidden in traditional tabular formats. Modern data visualization encompasses interactive elements, real-time updates, and customizable presentation options that accommodate different audience requirements and analytical depths. The discipline combines statistical accuracy with visual design principles to create compelling narratives that support decision-making processes. Advanced visualization platforms now incorporate artificial intelligence assistance and automated chart generation to streamline the creation process while maintaining analytical rigor.
Business Intelligence This analytical framework encompasses the technologies, processes, and strategies organizations employ to transform raw data into meaningful business insights. Business intelligence platforms integrate data from multiple sources, apply analytical models, and present findings through dashboards and reports that support strategic planning. The field has evolved from basic reporting capabilities to sophisticated predictive analytics and real-time monitoring systems. Modern business intelligence solutions emphasize self-service capabilities that enable business users to create their own analyses without extensive technical expertise.
Google Cloud The comprehensive cloud computing platform provides the infrastructure foundation for Looker Studio operations and hosts the computational resources necessary for advanced analytical features. Google Cloud's integration with Looker Studio enables seamless data connectivity, scalable processing capabilities, and enterprise-grade security protocols. The platform's global infrastructure ensures reliable performance across geographic regions while supporting compliance requirements for various industries. Recent developments include specialized services for artificial intelligence workloads and enhanced data governance capabilities that align with modern business intelligence requirements.
Connector These technical components establish data pathways between Looker Studio and external data sources, enabling unified reporting across disparate systems. Connectors handle authentication, data formatting, and refresh scheduling while maintaining security protocols appropriate for each source system. The expanding ecosystem of partner-developed connectors extends platform capabilities to include specialized data sources from marketing platforms, e-commerce systems, and industry-specific applications. Enhanced connector functionality now includes calculated field support and advanced filtering capabilities that reduce the technical complexity of data integration projects.
Chart Configuration The systematic approach to defining visualization parameters encompasses data field selection, styling options, and interactive functionality that determines how information appears to end users. Configuration processes now include automated assistance features that suggest optimal settings based on data characteristics and visualization best practices. Advanced configuration options enable precise control over colors, fonts, positioning, and behavioral elements that ensure consistent branding and user experience standards. The evolution toward guided configuration reduces the technical expertise required for creating professional-quality visualizations.
Filter Enhancement Advanced filtering capabilities enable users to focus on relevant data subsets through sophisticated condition logic and interactive controls. Modern filtering systems support natural language inputs, temporal ranges, and complex logical operations that accommodate diverse analytical requirements. Filter enhancements include visual feedback mechanisms and suggestion systems that guide users toward meaningful data exploration paths. The integration of filter-only fields and quick filter functionality provides flexibility for both report creators and viewers to adjust data perspectives without modifying underlying report structures.
Field Functionality The systematic organization and manipulation of data elements within Looker Studio encompasses calculated fields, custom dimensions, and automated field suggestions that streamline report creation processes. Field functionality now includes artificial intelligence assistance for creating complex formulas and transformations through natural language descriptions. Advanced field management features enable hiding sensitive information while maintaining data democratization principles essential for organizational analytics strategies. The expansion of field types and calculation capabilities reduces dependency on external data processing tools.
Platform Integration The comprehensive connectivity framework links Looker Studio with Google's broader ecosystem of productivity and analytical tools while supporting third-party integrations essential for enterprise workflows. Platform integration encompasses single sign-on capabilities, shared credential management, and unified data governance policies that simplify administration across multiple systems. Recent integration developments include artificial intelligence features that span multiple Google products and enhanced security controls that meet enterprise compliance requirements. The strategic approach to integration positions Looker Studio as a central component in organizations' digital transformation initiatives.
Who: Google Cloud engineering teams responsible for Looker Studio development and business intelligence professionals using the platform for data visualization and analysis.
What: Release of comprehensive waterfall chart documentation and enhanced Looker connector capabilities, including conditional formatting for query result chips, data label improvements, and custom column support for Search Ads 360 integration.
When: August 7, 2025, with general availability status for previously preview-only features and immediate implementation across all supported regions.
Where: Google Cloud's Looker Studio platform, affecting users globally with Looker-hosted instances and specific version requirements varying by hosting provider infrastructure.
Why: To expand data visualization capabilities for financial analysis, sequential process tracking, and business intelligence reporting while maintaining Google's competitive positioning in the enterprise analytics market against platforms incorporating advanced analytical functionality.