LinkedIn ads hit 121% ROAS as B2B buyer journeys stretch to 272 days
Dreamdata's 2026 LinkedIn Ads Benchmarks report shows 121% ROAS, 41% budget share, and 272-day buyer journeys drawn from 66M+ B2B sessions.

Dreamdata's 2026 LinkedIn Ads Benchmarks report shows 121% ROAS, 41% budget share, and 272-day buyer journeys drawn from 66M+ B2B sessions.
Dreamdata today released its LinkedIn Ads Benchmarks Report 2026, showing that LinkedIn has extended its lead as the only major advertising platform delivering positive returns for B2B marketers - with return on ad spend (ROAS) climbing from 113% in 2024 to 121% in 2025. The report, published March 10, 2026, is built on aggregated data from thousands of B2B companies covering more than 66 million sessions across more than 3.5 million complete customer journeys.
The findings mark a measurable shift from the previous year's report. According to the 2025 edition - which PPC Land covered in September 2025 - LinkedIn's ROAS stood at 113% and its share of total B2B ad spend sat at 39%. Both figures have moved higher.
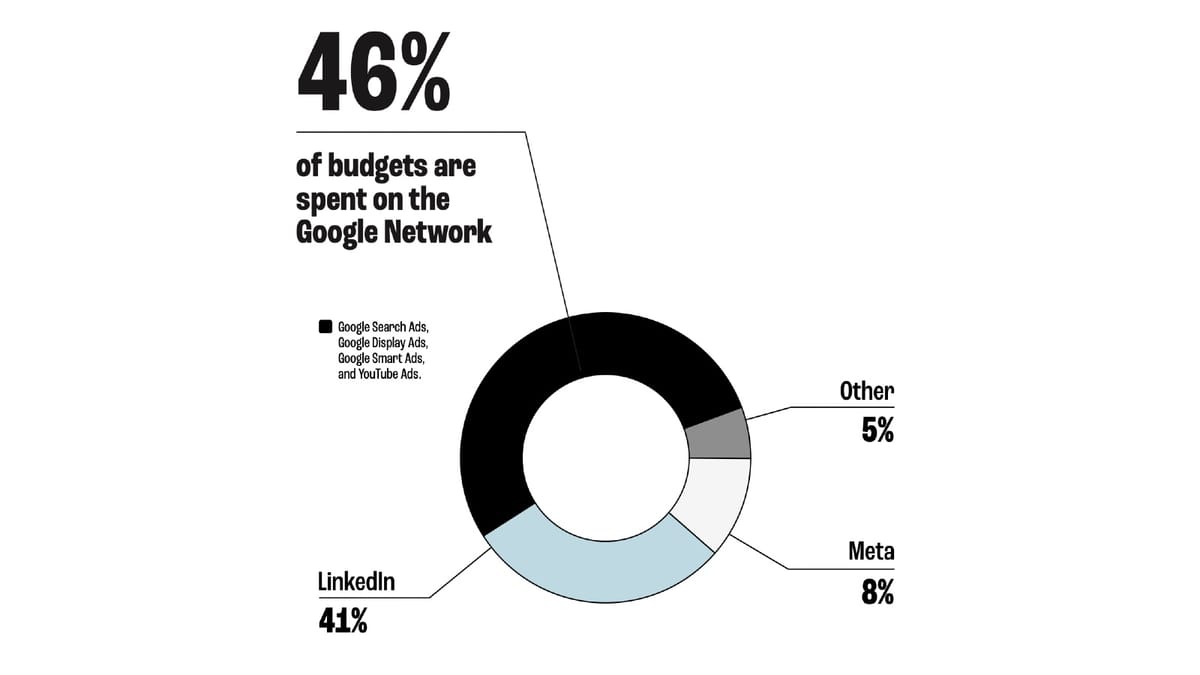
According to Dreamdata's report, LinkedIn Ads now account for 41% of total B2B paid media budgets among the company's customers - up two percentage points from 39% in 2024. While modest in absolute terms, the direction of travel matters: it is the continuation of a multi-year trend toward the platform.
The Google Network as a whole still commands the larger share at 46%, encompassing Google Search Ads (branded and non-branded), Google Display Ads, Google Smart Ads, and YouTube Ads. But when broken down by individual channel, LinkedIn remains the single largest line item. No single Google product reaches 41%.
Non-branded Google Search has taken the biggest hit. According to the report, B2B ad budgets directed at non-branded search terms dropped from 37% in 2024 to 33% in 2025. Cost-per-click for non-branded Google Search rose 29.36%, while click-through rates fell 26.16% over the same period - a combination that is making the channel harder to justify in budget reviews. The report attributes part of this to large language model-driven "zero-click" experiences, where AI-generated answers in search results satisfy buyer queries without any click to the advertiser's site.
Meta receives 8% of B2B ad spend, a figure that has remained unchanged year over year.
Surface-level cost metrics paint a misleading picture of LinkedIn's efficiency, and Dreamdata's report goes to some lengths to explain why.
LinkedIn's cost per click (CPC) rose from €5.35 in 2024 to €5.98 in 2025 - an 11.8% increase. Its cost per thousand impressions (CPM) rose from €26.62 to €34.33. On these metrics alone, LinkedIn looks expensive compared to Meta, whose CPC fell 11.6% to €1.60, and whose CPM came in at €9.18.
The comparison shifts when the unit of measurement changes from individuals to companies. According to the report, cost per company influenced - defined as the cost of reaching companies where at least one stakeholder had contact with an ad - dropped from €154 in 2024 to €70.11 in 2025 on LinkedIn. That is a 54% efficiency improvement at the account level. Meta's equivalent figure fell too, from €299 to €128.70, and Google Search's dropped from €222 to €110.37. LinkedIn's absolute number remains the lowest of the three.
The report notes that part of this efficiency gain reflects a technical development: Dreamdata released a new IP-to-company resolution engine in 2025 that identifies up to 15 times more companies visiting a given site. That change improves coverage and match rates, and makes the year-over-year cost comparison not perfectly like-for-like. The addition of LinkedIn's Company Intelligence API - launched in September 2025 - also enables Dreamdata to pull organic impressions and company-level engagement data for the first time, expanding the measurement surface.
Cost per contact influenced, by contrast, rose sharply across all platforms. LinkedIn's figure climbed 88.6% from €548 to €1,033.29. Google Search went from €266 to €362.39. Meta moved from €223 to €231.77. The report treats this metric as inherently limited for B2B purposes, given that winning deals requires reaching buying committees rather than single individuals.
According to Dreamdata's data-driven attribution model - applied to closed-won deals over a 12-month period, excluding impressions - ROAS figures across the three major platforms moved in divergent directions in 2025.
LinkedIn's ROAS rose from 113% to 121%, consolidating its position as the only platform returning more than the invested spend. Meta improved from 29% to 51%, a meaningful gain that still leaves it below breakeven in these calculations. Google Search fell from 78% to 67%, despite rising click costs.
The report also examines top-performer dynamics by excluding customers in the top 25% of ROAS outcomes - the extreme outliers. Under that filter, LinkedIn's ROAS more than doubles to 279%. Google Search reaches 138% and Meta 133%. The gap between LinkedIn and the others widens rather than narrows when high outliers are removed, suggesting that the platform's advantage is concentrated among advertisers running well-structured campaigns, not just statistical artifacts from a handful of exceptional cases.
LinkedIn's share of influenced new business deals grew from 35% in 2024 to 36% in 2025. Google Search moved from 25% to 31%, and Meta from 2% to 2%.
The 2026 report tracks significant structural changes in how B2B buyers move from first touch to closed revenue. The average total customer journey has extended from 211 days to 272 days - an increase of 61 days in a single year. The figure appeared prominently in Dreamdata CEO Nick Turner's foreword: according to Turner, it now takes an average of 272 days from the first marketing touch to closed revenue.
What is less obvious is that the lengthening is happening entirely in the pre-sales phase. The time a prospect spends in the sales pipeline - from SQL to closed-won - has actually shortened, from 62 days to 52 days. The time between MQL and SQL has also contracted, from 107 days to 92 days. Buyers are entering sales conversations later, but they arrive better informed and progress more quickly once they do.
According to the report, 81% of the B2B customer journey now takes place before the sales pipeline begins. One year ago, that figure was 70%. The shift of eleven percentage points in a single year reflects a broad movement toward buyer self-education, where prospects research, consume content, and form preferences long before they identify themselves to a vendor.
Journey length varies by company size. Large organizations (more than 250 employees) take 326 days from first touch to new business, with 220 of those days spent in the MQL-to-SQL stage alone. Medium companies (50 to 250 employees) take 224 days. Small companies (fewer than 50 employees) take 245 days, though the pattern within that journey has shifted - the time between MQL and SQL shortened from 76 to 17 days, with more time now spent inside the active sales cycle.
The buying committee has grown. According to the report, the average B2B deal now involves 10 stakeholders (up from 6.8), 88 total touchpoints (up from 76), and 4 channels (up from 3.7). These numbers are cumulative across the entire journey and speak to why contact-level measurement is structurally insufficient for B2B advertising evaluation.
Last year's benchmarks showed LinkedIn Ads were strongest at the MQL stage and weakened as prospects moved further down the funnel. That pattern has changed.
According to the 2026 report, LinkedIn Ads now account for 24.2% of all sessions at the MQL stage, rising to 30.2% at SQL and 28.3% at the New Business stage. LinkedIn's influence no longer declines as deals progress through the pipeline - it strengthens. The report interprets this as evidence that marketers are using LinkedIn not just for demand generation at the top of funnel, but as a tool for engaging buying groups during active sales conversations.
Time-to-revenue data supports this interpretation. The average time from a first LinkedIn Ads impression to revenueis 281 days. The time from first LinkedIn Ads conversion to revenue is 214 days. Perhaps the most counterintuitive finding: the time from first LinkedIn Ads engagement - defined as video views, likes, comments, and clicks - to revenue is 212 days, nearly identical to the conversion figure. The report interprets this as evidence that ad engagement signals revenue potential as reliably as formal conversions in long B2B cycles.
When LinkedIn Ads paid engagement data is included in revenue attribution modeling, according to the report, there is a 7.7x increase in the accuracy of measured ROI.
A section of the report is dedicated to the implications of LinkedIn's Company Intelligence API, which PPC Land reported on when LinkedIn launched it in September 2025. The API allows attribution partners such as Dreamdata to pull organic Company Page impressions alongside paid data - a capability that did not exist in the previous year's benchmarks.
According to tests by Dreamdata, integration with the Company Intelligence API yields up to a 10x increase in companies reached (accounts that saw content via paid or organic impressions) and up to a 4x increase in companies engaged (accounts that actively interacted with content). LinkedIn's own tests run through B2B Attribution and Analytics Partners showed 75.5% more attributed MQLs, 96% more attributed SQLs, and 43% lower attributed cost per acquisition.
The organic data also surfaces a finding that has direct implications for how marketers treat their LinkedIn Company Page. According to the report, 9.4% of MQLs include at least one organic Company Page impression in their journey, rising to 15% at the SQL stage and 17.9% for closed new business deals. Among those deals that included a Company Page impression, the average time from that first organic impression to deal close is 90 days.
The report frames this as an intent signal. A company visiting a LinkedIn Company Page is, in a measurable number of cases, on a path toward purchase - and that signal arrives roughly three months before revenue closes.
LinkedIn had previously enhanced its Revenue Attribution Report in July 2025 to support company-level measurement within Campaign Manager. The Company Intelligence API extends equivalent capabilities to third-party attribution platforms.
According to the 2026 benchmarks, 75% of Dreamdata customers using LinkedIn Ads have now integrated LinkedIn's Conversions API (CAPI). The figure is consistent with the 2025 benchmarks. PPC Land has tracked CAPI's development from its initial launch in November 2023, and the technology has since become a standard component of B2B LinkedIn advertising infrastructure.
The CAPI allows marketers to feed offline conversion data - pipeline updates and revenue events stored in a CRM - back into LinkedIn's ad delivery system. According to a LinkedIn internal study cited in the report, CAPI users achieve a 20% reduction in cost per action and a 31% increase in attributed conversions compared to standard tracking. Among CAPI users, 64% optimize their campaigns toward pipeline conversions and revenue, rather than top-of-funnel actions.
LinkedIn Matched Audiences has been adopted by 55% of Dreamdata customers. The technology allows advertisers to build targeting audiences from their own CRM and intent data and sync them to LinkedIn for campaign activation. According to the report, Dreamdata customers using Matched Audiences achieve LinkedIn company match rates above 90%, against an industry average of 29% to 62%.
The 2026 benchmarks reinforce a trend that has been building for several years: the metrics that appear most prominently in platform dashboards - CPC, CTR, cost per lead - are not well suited to B2B advertising evaluation. The report's consistent argument is that because B2B deals are won at the company level, across multiple stakeholders, over months, the relevant performance metric is cost per company influenced, not cost per contact.
LinkedIn's December 2024 advertising platform updates - which introduced data-driven attribution modeling and qualified leads optimization tied to CRM data - were specifically designed to move measurement in this direction. The 2026 benchmarks provide the first full-year dataset against which those tools can be evaluated.
The non-branded Google Search data adds a layer of context. CPCs for non-branded search rose sharply while CTRs fell, a combination that compresses margin on a channel traditionally valued for capturing intent at the point of decision. The report's framing - that AI-driven zero-click results are intercepting buyer queries before they reach advertiser sites - is consistent with patterns that PPC Land has covered in its broader reporting on AI's impact on digital advertising.
The structural finding that 81% of the B2B journey happens before sales is engaged - up from 70% one year ago - has implications that extend beyond LinkedIn specifically. It suggests the window during which marketing can influence a deal is longer than most attribution frameworks capture, and that the channels active during that pre-pipeline phase deserve measurement tools calibrated to long attribution windows.
Who: Dreamdata, a B2B Activation and Attribution Platform and LinkedIn Marketing Partner for Signals, Reporting, Audiences and Attribution, is the source of the benchmarks. The report draws on aggregated, anonymized data from thousands of the company's B2B customers.
What: The LinkedIn Ads Benchmarks Report 2026 presents performance data across LinkedIn, Google, and Meta for the 2025 calendar year. Key findings include a 121% ROAS for LinkedIn (up from 113%), a 41% budget share (up from 39%), cost per company influenced of €70.11 (down from €154), a 272-day average B2B customer journey (up from 211 days), and evidence that 81% of that journey occurs before the sales pipeline begins.
When: Dreamdata published the report today, March 10, 2026. The underlying data covers the period from August 2024 through July 2025, analyzed across 66 million sessions and 3.5 million customer journeys.
Where: The benchmarks reflect B2B advertising performance globally, drawn from Dreamdata's customer base of thousands of companies. The LinkedIn Company Intelligence API data - incorporated for the first time in this edition - is available globally through LinkedIn's certified B2B Attribution and Analytics Marketing Partners.
Why: The report exists to provide B2B marketers with external benchmarks for evaluating platform performance and budget allocation. According to the report's foreword, 78% of B2B CMOs say proving ROI has become more important over the past two years. The benchmarks are designed to offer context for that measurement challenge, particularly in an environment where the standard 30-day reporting cycle is structurally misaligned with a customer journey that averages 272 days.