WordStream last month published findings from one of the largest independent analyses of Google Ads account performance, revealing patterns of inefficiency that cut across industries, budget levels, and business sizes. The report, updated February 23, 2026, draws on 251,236 individual account assessments run through the company's free Google Ads Performance Grader tool between January 1, 2025, and November 17, 2025, covering 15,666 unique accounts across more than 23 industries.
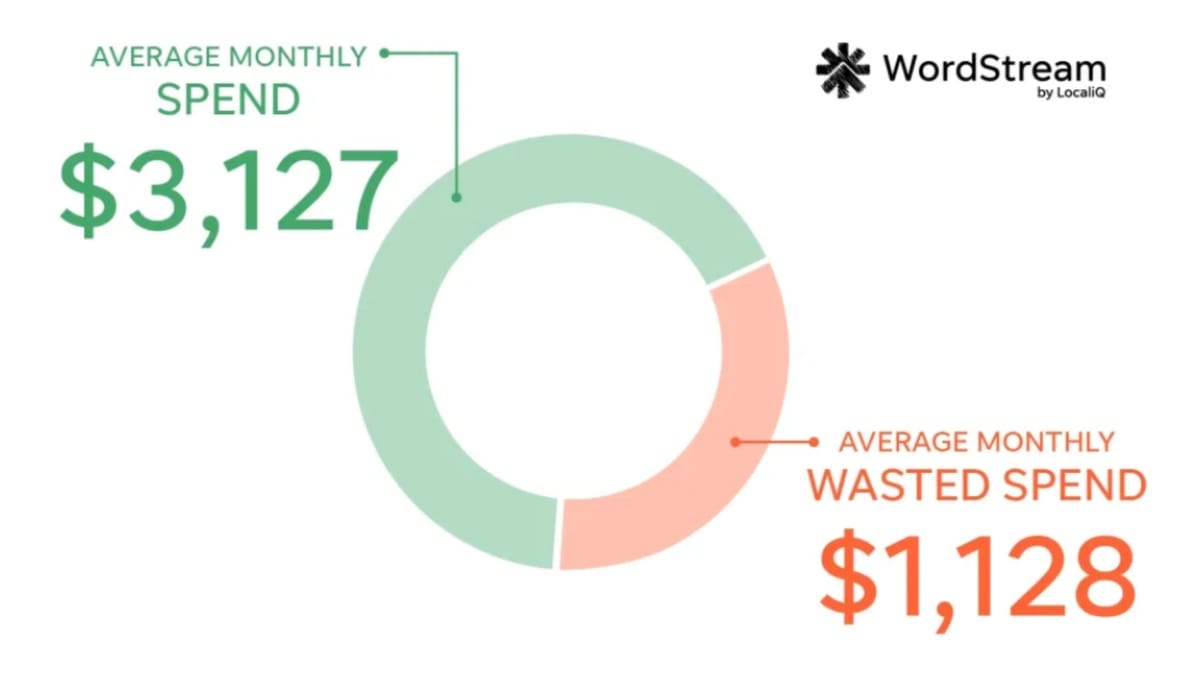
The scale of wasted spend is striking. According to the study, the average Google Ads account wastes $1,127.54 per month - or roughly $3,383 over a 90-day window. Given that the same dataset shows the median account spending approximately $3,127.38 per month, that figure represents more than a third of a typical search advertising budget going to clicks that generate no measurable return. A small number of accounts in the dataset wasted more than $10,000 per month.
The findings arrive at a moment when search advertising costs are rising steadily. A separate benchmark report from LocaliQ, released in May 2025, found that average cost per click in Google Ads reached $5.26, representing a 12.88% increase year-on-year across 16,000 campaigns. When budgets are tighter and clicks are more expensive, the margin for waste narrows. The WordStream data makes clear that for many businesses, that margin has already been exceeded.
Zero conversions, significant impressions
Perhaps the most unsettling number in the report concerns conversions entirely. According to the study, 29% of Google Ads accounts recorded zero conversions over a 90-day period. That is roughly one in four advertisers paying for impressions and clicks with no documented outcome. These same accounts still generated an average of 12,667 impressions per month.
The causes vary. WordStream points to missing or incorrectly configured conversion tracking as one possibility - campaigns may have driven results that simply were not captured. But the data also suggests structural problems. Non-converting accounts tended to spend less on average and had added fewer negative keywords compared to higher-performing counterparts. Some generated substantial impression volumes with no downstream effect, pointing to targeting gaps that allowed ads to appear in front of audiences with limited commercial intent.
The problem is not exclusive to smaller advertisers. According to the report, even among accounts spending more than $10,000 per month, 4% recorded zero conversions across the same 90-day window.
Budget size is not the decisive factor
One of the more counterintuitive findings in the study concerns the relationship between budget and performance. High-performing accounts - those with strong Quality Scores and conversion rates - are not necessarily the biggest spenders. According to the data, some accounts with large budgets fell short on both click-through rate and Quality Score, while smaller advertisers achieved better results with more disciplined account management.
The numbers support this directly. Small advertisers spending under $1,000 per month converted 32% better than accounts spending more than $10,000 per month, with conversion rates of 18.8% and 14.2% respectively. The performance gap runs in the opposite direction from what many advertisers assume.
The spending breakdown in the dataset shows 24% of accounts spend under $1,000 per month, 39% spend between $1,000 and $10,000, and 37% spend more than $10,000. Together these account for a broad cross-section of search advertisers, from small businesses to agencies managing enterprise budgets. According to the report authors, the data demonstrates that returns depend more on account hygiene and structural discipline than on raw spend levels.
This pattern has direct implications for how rising advertising costs translate into outcomes. Higher CPCs erode the returns of less efficient accounts faster. A business wasting 35% of a $3,000 monthly budget loses considerably more ground as click costs increase than one with tightly managed spend.
Negative keywords: the single variable with the most impact
Among all the variables examined, the presence or absence of negative keywords produced the sharpest performance divergence. Accounts with at least one negative keyword recorded an average monthly conversion rate of 13%. Accounts with no negative keywords averaged 4.6%. That is nearly a threefold difference in conversion efficiency from a single structural decision.
The mechanism is straightforward. Negative keywords prevent ads from serving against irrelevant queries. Without them, an account accumulates impressions from searches that share surface-level characteristics with target keywords but carry no real commercial intent. High impression volumes mask poor targeting, and budgets erode on clicks that were never likely to convert.
According to the report, 25% of businesses in the dataset had not added a single negative keyword to their accounts. This is a significant finding in the context of Google's own expanding negative keyword tools, including the addition of a negative keyword tab within the Keyword Planner tool and the expansion of negative keyword limits for Performance Max campaigns from 100 to 10,000 in March 2025. The infrastructure for exclusion management has improved substantially, yet a quarter of accounts in this study had not taken even the first step of adding a single negative term.
Quality Score: most accounts fall in the middle
Quality Score functions as a diagnostic indicator within the Google Ads platform, reflecting ad relevance, expected click-through rate, and landing page experience. It does not directly enter the ad auction but signals where accounts have room to improve. According to the WordStream study, the average Quality Score across graded accounts over 90 days fell between 5 and 6.
Scores above 7 are relatively uncommon. Only 22% of accounts in the dataset reached a Quality Score of 7 or above. Accounts reaching 8 or higher represent just 12% of the sample. At the other end, 36% of accounts had a Quality Score below 4.
Industry context matters here. Shopping, Collectibles and Gifts achieved an average Quality Score of 6.90 across the dataset, while Apparel, Fashion and Jewelry reached 7.36 - the highest of any category. Sports and Recreation came in at 6.75. At the lower end, Dentists and Dental Services averaged 4.84, Physicians and Surgeons 4.95, and Attorneys and Legal Services 5.02. These professional services categories face inherent challenges around ad relevance and landing page specificity that push average scores down across the industry.
The relationship between Quality Score and account structure is direct. According to the broader guidance on responsive search ads and campaign management, relevance between keywords, ad copy, and landing pages is the primary driver of Quality Score improvement. Structural fragmentation - grouping too many dissimilar keywords into the same ad group - dilutes relevance and suppresses scores.
Impressions do not predict conversions
A persistent assumption in digital advertising holds that more visibility produces more outcomes. The WordStream data challenges this directly. Accounts with fewer than 20,000 impressions over a 90-day period recorded the highest average conversion rate in the dataset, at 4.1%. Accounts exceeding 80,000 impressions over the same period converted at just 2.4%.
The pattern likely reflects targeting discipline. Accounts with limited impression volume are often running tighter keyword lists with more restrictive match types, which concentrates ad delivery among higher-intent searches. The accounts generating the largest impression volumes frequently rely on broader match configurations that capture more queries but with weaker intent alignment.
It is worth noting that even the 4.1% figure for the lowest impression tier falls below the 7.52% average conversion rate cited in WordStream's separate benchmark study based on campaigns managed through the LocaliQ platform. A separate WordStream study from July 2025 cited that same 7.52% figure as the current benchmark for search advertising performance - a reminder that the accounts analyzed through the Performance Grader tool represent a self-selected group, not a managed cohort.
The structural characteristics of top-performing accounts follow a consistent pattern. According to the study, high-performing accounts - defined by strong Quality Scores and conversion rates - used roughly two to three times more ad groups per account than low-performing counterparts, and ran more campaigns overall.
The implication is that granular segmentation separates intent signals more cleanly. More campaigns allow for distinct budget allocation and bidding strategies by goal, location, or service line. More ad groups align keywords, ad copy, and landing pages more tightly, improving relevance and thus Quality Score and Ad Rank. Lower-performing accounts in the study tended to consolidate many keywords into broad campaigns with unfocused ad groups, which dilutes all three components of Quality Score simultaneously.
This structural philosophy contrasts with some of the consolidation guidance that Google itself has promoted for automated campaign types. A February 2026 analysis published on PPC Land examined Google's position that artificial intelligence-powered campaign management benefits from fewer, larger campaigns that provide more data density for machine learning. The WordStream findings, based on accounts across both traditional and automated campaign types, show that more granular structures still correlate with better outcomes across the overall account population. The tension between manual control and algorithmic consolidation remains unresolved in the industry.
Only 3% of accounts in the dataset achieved what WordStream characterizes as elite performance - a Quality Score of 8 or above combined with a conversion rate exceeding 10%. The rarity of that combination underscores how difficult sustained high performance is to maintain across all components simultaneously.
The WordStream report lands at a point of meaningful pressure for search advertisers. Benchmarks published by Pixis in September 2025, covering $996 million in Google Ads spend across 100 consumer brands, showed dramatic cost variations between industries and highlighted the growing importance of conversion value calculations for justifying spend. Against that backdrop, the 29% zero-conversion rate and the $1,127 monthly waste figure represent a concrete cost of inaction.
The study also adds texture to the debate around Google's AI-powered campaign tools. When one in four accounts has never added a single negative keyword, and when the average account wastes more than a third of its monthly budget, the baseline conditions for effective automation are often absent. Machine learning systems optimize within the constraints advertisers provide. Accounts without structured exclusions, clear conversion signals, or organized campaign hierarchies hand those systems less to work with.
The former Google insider analysis published on PPC Land in October 2025 noted that even experienced practitioners can operate on outdated assumptions about how the platform functions, including assumptions about which automation features improve performance and which create account behavior that defies explanation. The WordStream data suggests that foundational practices - negative keywords, campaign structure, conversion tracking - remain the primary determinants of performance outcomes even as the platform's automation layer has grown more sophisticated.
The report was co-authored by Susie Marino, Elisa Gabbert, and Stephanie Heitman, with data analysis contributions from Paul Fontenot, Rob Glover, Heidi Hickman, and Becca Mann. All averages in the study are median figures, calculated to reduce the influence of outliers. Currency values are reported in US dollars.
Timeline
- June 10, 2024 - LocaliQ releases benchmark data showing 86% of industries experienced Google Ads cost increases, with average CPC rising 10.43% year-on-year, covering campaigns from April 2023 to March 2024. PPC Land coverage
- October 9, 2024 - Google Ads adds a negative keyword tab within the Keyword Planner tool, enabling advertisers to research and manage exclusions within a single planning interface. PPC Land coverage
- October 15, 2024 - Google updates its third-party policy, introducing severe penalties for agencies enabling policy violations on managed accounts. PPC Land coverage
- January 1, 2025 - WordStream begins collecting data for the Performance Grader study, eventually covering 251,236 reports across 15,666 accounts.
- March 10, 2025 - Google increases the negative keyword limit for Performance Max campaigns from 100 to 10,000, following direct advertiser feedback. PPC Land coverage
- May 19, 2025 - LocaliQ releases updated benchmark data showing average Google Ads CPC rose 12.88% year-on-year to $5.26, with 87% of industries experiencing cost increases. PPC Land coverage
- June 4, 2025 - Google releases Ads API v20, introducing campaign-level negative keywords for Performance Max campaigns alongside enhanced Demand Gen reporting. PPC Land coverage
- July 10, 2025 - WordStream publishes research finding 20% of AI tool responses to PPC questions contain inaccurate information, with Google AI Overviews showing the highest error rate at 26%. PPC Land coverage
- August 7, 2025 - Google announces completion of its 2025 Performance Max enhancement program, including campaign-level negative keyword lists, expanded search themes, and demographic targeting controls. PPC Land coverage
- October 28, 2025 - A former Google employee publicly characterizes Search Partner Network inventory quality as problematic, generating significant engagement from the marketing community. PPC Land coverage
- November 17, 2025 - WordStream concludes data collection for the Performance Grader study.
- September 28, 2025 - Pixis publishes benchmark analysis of $996 million in Google Ads spend across 100 consumer brands, documenting dramatic cost variations by industry. PPC Land coverage
- February 23, 2026 - WordStream publishes the seven-finding report drawn from 251,236 Performance Grader assessments, revealing $1,127 average monthly waste, a 29% zero-conversion rate, and the threefold conversion rate benefit of negative keywords.
Summary
Who: WordStream, a digital advertising software company owned by USA TODAY Co., Inc., authored the report. The research team was led by Susie Marino, with contributions from Elisa Gabbert, Stephanie Heitman, and four data analysts. The findings affect the estimated 15,666 accounts represented in the dataset and the broader population of Google Ads advertisers.
What: An analysis of 251,236 Google Ads Performance Grader reports identified seven key findings about account performance: average monthly waste of $1,127.54; a 29% zero-conversion rate over 90 days; outperformance by smaller advertisers relative to large-budget accounts; average Quality Scores between 5 and 6; a nearly threefold conversion rate improvement for accounts using negative keywords; lower conversion rates among high-impression accounts; and consistent structural differences between top and bottom performers.
When: Data was collected between January 1, 2025, and November 17, 2025. The report was published and last updated February 23, 2026.
Where: The analysis covers Google Ads accounts across more than 23 industries operating in the United States. All spend figures are denominated in US dollars.
Why: The report aims to document performance patterns across a broad sample of Google Ads accounts, providing advertisers with data on where common inefficiencies arise and which structural variables correlate with better outcomes. The findings are particularly relevant at a time when Google Ads costs are rising across industries, making unaddressed waste proportionally more damaging to advertiser returns.
Share this article
The link has been copied!