TVision finds streaming attention differs by content type and release strategy
TVision's State of Streaming report reveals original content captures 8.5% more attention than library programming while weekly release schedules drive higher engagement.

TVision's State of Streaming report reveals original content captures 8.5% more attention than library programming while weekly release schedules drive higher engagement.
TVision released its biannual State of Streaming report on August 12, 2025, revealing significant differences in viewer attention patterns across streaming content types and release strategies. The comprehensive analysis examines streaming landscape trends during the first half of 2025, providing marketers with detailed insights into viewer engagement across major platforms.
The report demonstrates that original content—programming first released on streaming platforms—captures 64% attention compared to 59% for library content, representing an 8.5% difference. Library content includes programming that previously aired on other platforms before streaming release. "It is likely that viewers make plans to intentionally find and watch original content, whereas library content may serve as familiar background television for households," the report states.
Subscribe the PPC Land newsletter ✉️ for similar stories like this one. Receive the news every day in your inbox. Free of ads. 10 USD per year.
Release strategy significantly impacts viewer attention levels, with weekly release schedules generating the highest engagement rates. Viewers who watch weekly release content during the first week of availability pay 67% attention, compared to 61% for binge viewing of binge release content. The 11% difference suggests that traditional broadcast-style release patterns maintain viewer focus more effectively than streaming's characteristic binge model.
YouTube dominates viewing time across streaming platforms, capturing 21% of total time spent compared to Netflix's 14%. Despite this, Netflix content dominated the first half of 2025 rankings, with nine shows and eight movies appearing in the top 20 Power Score rankings. Hulu's "Paradise" claimed the top overall program position while Netflix's "Back in Action" led movie rankings.
Platform reach statistics show YouTube reaching 61% of streaming-enabled households, followed by Netflix at 58% and Amazon Prime Video at 54%. The average American household accessed 4.2 streaming apps during Q2 2025, with eight percent of households using ten or more apps during the same period.
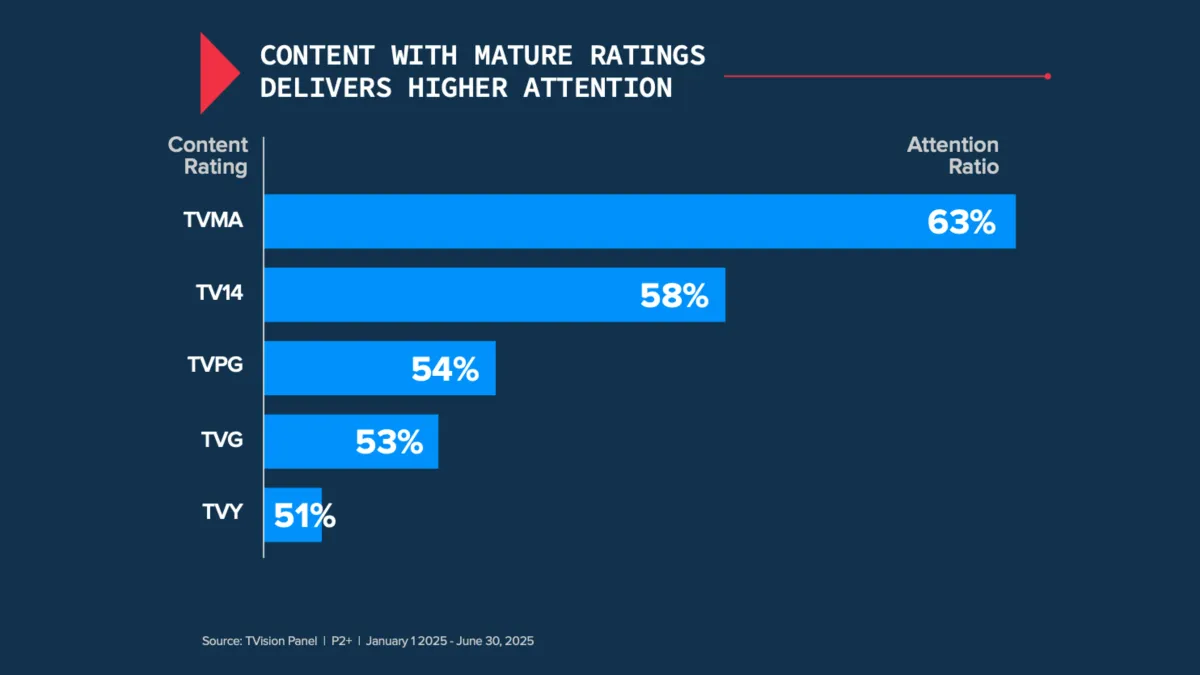
Content ratings create notable attention pattern variations. Mature-rated content delivers higher attention rates, with TVMA content achieving 63% attention compared to 51% for TVY programming. However, family-friendly content generates significantly higher co-viewing rates, with TVY programming reaching 81% co-viewing compared to 60% for TVMA content. This trade-off presents strategic considerations for advertisers choosing between high attention and broader household reach.
Brand category alignment with content genres impacts advertising attention rates. Travel and home improvement brands see particularly strong performance when advertising appears in contextually relevant content. The data reveals attentive lift reaching 22% for outdoor and nature content matched with appropriate brand categories.
The report identifies specific brands achieving superior attention capture during the first half of 2025. Ray-Ban leads apparel advertising at 59% attention, while Discount Tire tops automotive categories at 63%. Canada Dry performs best in food and beverage advertising at 67% attention, significantly exceeding the 52% industry average.
Live sports streaming demonstrates varying engagement patterns across different leagues. WNBA streaming games generate higher attention than linear broadcasts with an attention index of 121, while maintaining 1.59 viewers per viewing household. Conversely, Premier League streaming shows lower co-viewing rates at 1.37 viewers per household compared to linear television's 1.64 viewers per household.
Technical measurement capabilities reveal streaming platform usage patterns among streaming-enabled households. The data shows 86% of streaming-enabled households actively access streaming content, while 69% continue using cable programming and 54% watch broadcast television. This multi-platform consumption creates complex measurement challenges for advertisers tracking cross-platform campaigns.
The research addresses marketer concerns about streaming measurement accuracy and optimization strategies. John Rose, Senior Partner Emeritus and Senior Advisor at BCG, states in the report's foreword: "For marketers, CTV is becoming a material opportunity, and they are responding with larger investments. Streaming apps are presenting creative opportunities for media investments—traditional TV ads, pause ads, and shorter ads."
The report's methodology relies on TVision's computer vision technology measuring second-by-second viewer engagement across 5,000 homes. The measurement system tracks presence-in-room and attention for every programming and advertising second, providing person-level data weighted to represent national viewing patterns.
These findings matter significantly for the marketing community because streaming television continues gaining prominence while creating new measurement complexities. Traditional television measurement approaches struggle with streaming's fragmented landscape, making attention-based metrics increasingly important for campaign optimization. Recent industry developments show major measurement companies integrating attention metrics into their platforms, validating TVision's approach.
The data contradicts assumptions about optimal streaming advertising strategies. While binge viewing defines streaming culture, weekly release content generates superior attention rates when viewed during initial release periods. This suggests advertisers might achieve better performance by aligning campaigns with weekly release schedules rather than binge releases.
Marketing professionals can leverage these insights for strategic planning across multiple areas. Content alignment becomes crucial for attention optimization, with genre-brand matching delivering measurable performance improvements. Release timing strategies should consider attention patterns favoring early weekly viewing over binge consumption periods.
The streaming landscape fragmentation creates both opportunities and challenges for advertisers. While average household streaming app usage remains manageable at 4.2 apps, the minority using ten or more apps represents highly engaged streaming audiences potentially valuable for targeted campaigns.
Platform-specific strategies require nuanced approaches based on attention and reach patterns. YouTube's time dominance suggests strong advertising opportunities despite lower per-program attention rates compared to premium streaming content. Netflix's content performance strength indicates value in original programming adjacencies.
Live sports measurement reveals league-specific engagement patterns requiring customized advertising approaches. WNBA streaming superiority over linear broadcasts suggests streaming platforms may better serve certain sports advertising compared to traditional television placements.
The report's brand attention rankings provide competitive benchmarking across categories. Attention rates above industry averages indicate successful creative and placement strategies, while below-average performance suggests optimization opportunities through content alignment or creative modification.
These measurement insights become increasingly important as Connected TV advertising expands globally and cross-platform measurement becomes standard. Attention-based metrics complement traditional reach and frequency measurements by providing engagement quality indicators essential for campaign optimization.
The technical measurement complexity reflects streaming's multi-device, multi-platform consumption patterns. TVision's approach measuring actual viewer attention rather than device activity addresses fundamental streaming measurement challenges affecting budget allocation decisions.
Marketing effectiveness depends increasingly on understanding these attention patterns as streaming advertising spending grows. The report's data provides actionable insights for campaign planning, creative development, and media buying strategies across the expanding streaming ecosystem.
Subscribe the PPC Land newsletter ✉️ for similar stories like this one. Receive the news every day in your inbox. Free of ads. 10 USD per year.
Subscribe the PPC Land newsletter ✉️ for similar stories like this one. Receive the news every day in your inbox. Free of ads. 10 USD per year.
Who: TVision Insights released the report with commentary from John Rose, Senior Partner Emeritus and Senior Advisor at BCG, highlighting the growing importance of streaming television for marketers.
What: The State of Streaming report analyzes viewer attention patterns across streaming platforms, revealing that original content captures 8.5% more attention than library content, while weekly release strategies outperform binge releases by 11% in attention metrics.
When: Published on August 12, 2025, covering data from the first half of 2025 (January 1 - June 30, 2025) collected from TVision's panel of 5,000 homes.
Where: The analysis covers streaming consumption patterns across America's TVs, with 86% of streaming-enabled households actively accessing streaming content alongside continued cable (69%) and broadcast (54%) usage.
Why: The report addresses marketer needs for accurate streaming measurement as connected television becomes "a material opportunity" with increasing advertiser investments in streaming platforms that present new creative advertising opportunities including traditional TV ads, pause ads, and shorter ad formats.