Amazon quietly shifts Brand Store ratings to prioritize sales over time spent
Amazon replaced Brand Store quality ratings with sales-based scoring on December 12, 2025, abandoning engagement metrics for revenue attribution.

Amazon replaced Brand Store quality ratings with sales-based scoring on December 12, 2025, abandoning engagement metrics for revenue attribution.
Amazon Advertising replaced its Brand Store quality rating methodology on December 12, 2025, abandoning engagement-based scoring in favor of sales performance attribution. The update fundamentally changes how brands measure storefront effectiveness across the platform's retail media network.
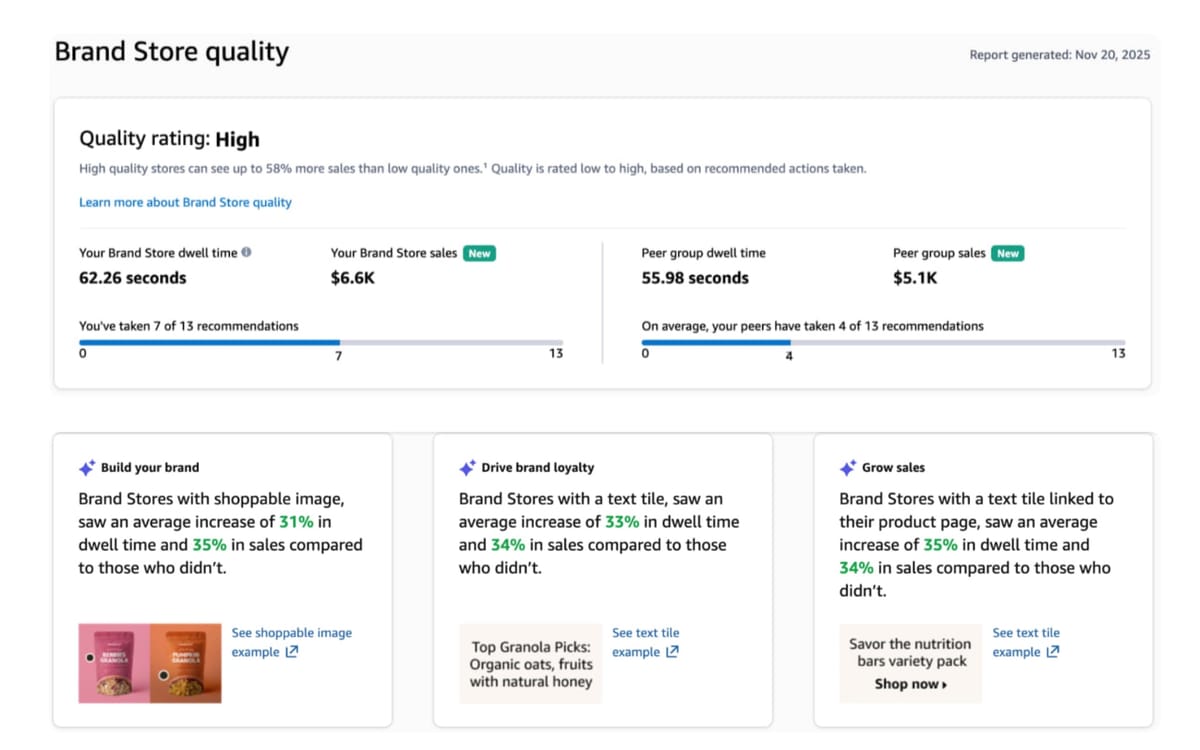
The revised quality rating system now assigns High, Medium, or Low classifications based on sales attributed to Brand Store visits rather than visitor dwell time, according to the announcement. Amazon's internal data indicates high-quality stores generate up to 97% more sales than low-quality counterparts and 39% more sales compared to medium-quality stores during the period from July 5 through September 6, 2025.
Subscribe PPC Land newsletter ✉️ for similar stories like this one
Brand Store quality ratings previously centered on average dwell time—how long customers spent browsing storefronts—and comparisons with peer group performance. While these engagement metrics remain visible within the insights dashboard, they no longer determine the overall quality classification. The shift reflects broader measurement trends across retail media platforms where attribution to actual purchases increasingly supersedes proxy engagement indicators.
Amazon launched the updated experience globally on December 12 across 29 countries spanning North America, South America, Europe, the Middle East, and Asia Pacific. Advertisers with Brand Stores can access the new quality rating through the Brand Store insights dashboard within the advertising console by selecting the "Brand Store quality" tab.
The technical implementation introduces two new API parameters enabling programmatic access to sales-based metrics. PEER_SALES_LAST_60_DAYS and SALES_LAST_60_DAYS provide 60-day rolling sales data through the Brand Store insights metrics API, accessible via the advertising platform's developer documentation.
The measurement window captures sales occurring within 14 days following Brand Store visits, maintaining Amazon's standard attribution period for store-level conversion tracking. This methodology aligns with how Amazon measures Brand Store performance across its existing metrics, including orders, units sold, and revenue attributed to specific traffic sources.
Brand Stores function as dedicated storefronts within Amazon's marketplace where brands control layout, imagery, content hierarchy, and product organization across multiple categories. Unlike individual product detail pages, these properties enable brands to construct narrative shopping experiences with custom design elements, video content, shoppable images, and strategic product groupings.
The quality rating system evaluates stores against category peers—brands selling similar product types at comparable scale. This peer comparison methodology prevents cross-category comparisons between fundamentally different business models, such as electronics manufacturers versus apparel retailers. Amazon determines peer groups algorithmically based on product categorization, sales volume patterns, and marketplace presence.
Optimization recommendations within the dashboard now display potential sales impact alongside dwell time projections. A recommendation might indicate that adding background video could increase sales by a specific percentage while also improving average browsing duration by a measured increment. This dual-metric approach acknowledges that engagement duration correlates with but does not directly determine sales outcomes.
The Brand Store analytic metrics API provides dimensions for aggregating insight metrics across different variables. DATE, PAGE, SOURCE, TAG, and STORE dimensions enable reporting at various organizational levels depending on analysis requirements. The STORE dimension specifically supports DWELL_TIME, BOUNCE_RATE, and NEW_TO_STORE metrics for store-level performance evaluation.
Available insight metrics span views, orders, units, sales, visits, visitors, score level, recommendations, contributors, dwell time, peer dwell time, bounce rate, and new-to-store visitor counts. Each metric serves distinct analytical purposes within the comprehensive measurement framework Amazon provides for Brand Store operators.
ASIN-level metrics complement store-level reporting by tracking individual product performance within storefronts. These include views per ASIN, orders attributed to ASIN views, units purchased during attributed orders, add-to-cart events, in-stock view counts, average in-stock pricing, in-stock rates, average sale prices, conversion rates, click counts, click-through rates, and render frequencies.
The API accepts requests spanning up to 100 days between start and end dates, with the difference between those dates unable to exceed 100 days. This constraint ensures query performance while providing sufficient historical depth for trend analysis and seasonal comparison.
Quality and recommendation metrics—SCORE_LEVEL, RECOMMENDATIONS, CONTRIBUTORS, DWELL, and PEER_DWELL—can only be aggregated by the DATE dimension according to current API specifications. These metrics operate at the store level rather than page or traffic source granularity, reflecting their function as holistic health indicators rather than tactical performance measures.
Response structures return dimension specifications alongside metrics details containing the requested data points. A typical response includes the score level classification, specific date stamps, dwell time measurements, recommendation arrays with suggested actions and observed average dwell time increases, contributor arrays listing implemented improvements, and peer dwell time comparisons.
Buy ads on PPC Land. PPC Land has standard and native ad formats via major DSPs and ad platforms like Google Ads. Via an auction CPM, you can reach industry professionals.
Amazon systematically expanded attribution capabilities throughout 2024 and 2025, introducing branded search tracking enhancements, conversion path reporting, and offline sales measurement across multiple product categories. The Brand Store quality rating update fits within this broader measurement infrastructure development.
The platform added Brand Store page views as a trackable metric for Sponsored Brands campaigns on November 3, 2025, with historical data extending to September 15. This metric quantifies advertising-driven traffic to Brand Stores specifically from Sponsored Brands advertisements, creating attribution connections between upper-funnel brand awareness spending and storefront engagement.
Amazon consolidated its sponsored ads and DSP platforms into a unified Campaign Manager on November 10, 2025, seven days before announcing the Brand Store quality rating changes. The integrated interface provides cross-channel visibility combining Sponsored Products, Sponsored Brands, and programmatic display campaigns within a single workspace.
That consolidation enabled advertisers to analyze how Amazon DSP exposure contributes to Brand Store visits alongside Sponsored Brands performance. The ability to connect programmatic display advertising touchpoints with subsequent storefront engagement represents a measurement advancement that the sales-based quality rating complements by quantifying the commercial outcomes of those visits.
Amazon launched unified reporting capabilities on November 11, 2025, streamlining data analysis across sponsored ads and DSP campaigns through a report builder interface. The standardized metric names and definitions across campaign types reduce friction when comparing performance across different advertising formats and products.
Brand Stores received three engagement metrics—average bounce rate, average dwell time, and new-to-store visitors—through the Brand Stores Insights dashboard in February 2024. Those metrics measure on-site behavior after visitors arrive, while the Brand Store page views metric tracks the advertising touchpoints driving initial visits.
The February 2024 metrics introduction represented Amazon's first substantive expansion of Brand Store analytics beyond basic traffic and sales figures. Average bounce rate quantifies visitors leaving without taking action, average dwell time indicates browsing duration across pages, and new-to-store visitors identifies first-time shoppers encountering the storefront.
Amazon's advertising business generated $17.7 billion in the third quarter of 2025, representing 22% year-over-year growth according to financial disclosures. The platform competes directly with Google Search through Sponsored Products listings and increasingly with connected television advertising through Prime Video and Fire TV placements.
Retail media networks have expanded substantially as advertisers shift budgets toward channels offering first-party consumer data and closed-loop attribution. The ability to connect ad exposure directly to purchases within the same ecosystem provides measurement precision unavailable through traditional advertising channels where attribution relies on probabilistic modeling or third-party tracking mechanisms.
Amazon expanded offline sales measurement to five product categories on November 4, 2025, through Omnichannel Metrics functionality. This capability enables advertisers in fashion, home goods, grocery, health and beauty, and automotive categories to measure physical store purchases following Amazon Ads exposure.
The measurement advancement acknowledges that 72% of US retail sales occur in physical stores according to Forrester research cited in Amazon documentation. Advertisers operating both e-commerce and brick-and-mortar retail channels require measurement solutions accounting for the full customer journey from digital ad exposure to physical store purchase.
Sales-based quality ratings align Brand Store measurement with broader industry trends emphasizing business outcomes over engagement proxies. While dwell time correlates with purchase intent—shoppers spending more time browsing typically demonstrate higher conversion probability—the correlation does not establish causation and can vary significantly across product categories and customer segments.
Electronics shoppers might spend extensive time researching specifications before purchasing elsewhere based on price, while impulse purchase categories might generate immediate conversions despite minimal browsing duration. Category-specific behavioral patterns complicate cross-category engagement comparisons, supporting Amazon's decision to implement peer group comparisons and prioritize actual sales attribution.
Amazon released a comprehensive profit analytics dashboard on September 18, 2025, providing sellers with SKU-level profitability calculations incorporating advertising costs, fees, and seller-provided financial inputs. The dashboard integrates Sponsored Products data automatically, eliminating manual entry requirements for platform-native advertising expenses.
Third-party measurement providers compete with platform-provided solutions across the retail media ecosystem. Integral Ad Science secured Media Rating Council accreditation for Amazon DSP measurement on November 13, 2025, validating server-to-server integration for tracking impression, viewability, and invalid traffic data.
Advertisers access the updated quality rating without configuration changes or opt-in requirements. The system operates automatically for all brands with active storefronts, applying the new methodology to calculate classifications based on trailing sales performance within the designated attribution window.
The recommendations engine surfaces specific actions brands can implement to improve store quality alongside projected impact metrics. Suggested optimizations might include adding video content, creating additional subpages, implementing product grid layouts, incorporating shoppable images, or utilizing text tiles for storytelling and navigation.
Each recommendation includes observed average dwell time increase percentages based on aggregate performance data across peer stores that implemented similar changes. These projections now accompany sales impact estimates, providing advertisers with dual perspectives on how specific modifications might influence both engagement duration and revenue generation.
Contributors arrays list recommendations that store owners have already implemented, documenting the optimization path that led to current quality classifications. This historical record enables brands to understand which previous actions contributed to rating improvements or identify gaps where recommended optimizations remain unaddressed.
Dwell time and peer dwell time metrics continue appearing within the dashboard despite no longer determining quality classifications. Amazon positioned this as providing comprehensive visibility into store performance across multiple dimensions rather than eliminating engagement measurement entirely.
The average time customers spend browsing specific stores compares against how long shoppers engage with similar brand storefronts on average. Significant deviations from peer performance might indicate content quality issues, navigation problems, or creative differentiation depending on whether the variance runs positive or negative.
Bounce rate quantifies the ratio of single-page visits to total landing visits, measuring how frequently customers arrive at a Brand Store and immediately exit without engaging further. High bounce rates potentially signal misalignment between advertising messaging and storefront content, technical performance issues, or insufficient immediately visible value propositions.
New-to-store visitor counts track unique shoppers encountering the storefront for the first time, providing audience expansion metrics complementing return visitor engagement. Brands prioritizing customer acquisition might emphasize new-to-store growth, while those focused on loyalty and repeat purchase might optimize for return visitor frequency and average order values.
The feature launched simultaneously across Amazon's global advertising marketplace on December 12, 2025. North American availability includes the United States, Canada, and Mexico. South American access extends to Brazil exclusively within that region.
European markets encompass the United Kingdom, Germany, Spain, Italy, France, Belgium, Switzerland, Poland, Netherlands, Sweden, and Ireland. Middle Eastern territories include Egypt, Turkey, United Arab Emirates, and Saudi Arabia. Asia Pacific coverage spans Australia, Japan, India, and Singapore.
This geographic distribution matches Amazon's primary advertising markets where Brand Stores operate at scale. Smaller marketplaces where Amazon maintains retail presence but limited advertising infrastructure do not appear on the supported countries list, suggesting the feature requires minimum advertiser population thresholds to generate meaningful peer comparisons.
The simultaneous global launch contrasts with Amazon's typical pattern of introducing features initially in North American markets before expanding internationally. The coordinated release suggests significant development investment and infrastructure preparation enabling worldwide deployment without staged rollout requirements.
API access follows the same geographic availability as the user interface implementation. Advertisers operating across multiple countries can programmatically retrieve sales-based quality ratings for each marketplace through unified API calls specifying appropriate country codes and account identifiers.
Amazon introduced artificial intelligence agents at its unBoxed conference on November 11, 2025, designed to automate campaign management tasks across the advertising ecosystem. The Ads Agent system processes natural language prompts to set up and adjust multi-format campaigns across Sponsored Products, Sponsored Brands, display, and streaming television.
The sales-based quality rating provides data inputs that AI optimization systems can utilize when making programmatic decisions about campaign configurations, budget allocations, and targeting parameters. Machine learning models trained on historical performance patterns can identify correlations between store quality classifications and campaign effectiveness across various advertising products.
Amazon launched a Model Context Protocol Server in closed beta on November 13, 2025, creating standardized access layers connecting AI models and agents with the advertising platform. The MCP Server transforms complex API operations into conversational queries, enabling large language models to access campaign data, performance metrics, billing information, and account details.
Brand Store quality ratings accessed through these AI agent interfaces could inform automated optimization recommendations, proactive campaign adjustments, or strategic planning suggestions based on observed relationships between store performance and advertising outcomes across peer groups.
The shift from engagement to sales measurement aligns with outcome-focused optimization that AI systems can execute more effectively than subjective engagement quality assessments. Clear numerical sales targets enable algorithmic optimization toward specific business objectives rather than ambiguous engagement improvement goals.
The measurement methodology change reflects broader industry standardization efforts around retail media performance evaluation. IAB and IAB Europe released in-store retail media measurement standards for public comment in September 2024, establishing unified definitions for store zones, ad formats, and performance metrics.
These standardization initiatives aim to create comparable measurement across retail media networks, reducing fragmentation that currently complicates cross-platform performance assessment. Advertisers operating campaigns across Amazon, Walmart Connect, Target Roundel, Instacart Ads, and specialty retail media networks face challenges comparing effectiveness when each platform employs different counting methodologies and attribution windows.
Sales-based quality ratings prioritize the outcome metric most universally relevant across retail media environments. While engagement patterns vary significantly by product category, shopping context, and customer segment, sales attribution provides standardized comparison enabling cross-platform evaluation despite implementation differences.
The focus on sales performance rather than engagement duration acknowledges that Brand Stores serve commercial objectives rather than editorial content consumption. Unlike media properties where time spent represents successful audience engagement, retail environments measure success through transaction completion regardless of browsing duration.
Platform consolidation across Amazon's advertising products creates infrastructure enabling unified measurement approaches. The November 10 Campaign Manager integration eliminated fragmented workflows previously requiring separate management of sponsored ads and programmatic DSP campaigns, establishing technical foundations for comprehensive cross-channel attribution.
Advertisers increasingly demand tools measuring longer-term brand building effects alongside short-term sales generation. The dual presentation of sales impact and dwell time projections within optimization recommendations acknowledges this need while prioritizing commercial outcomes in quality classification algorithms.
Amazon maintains comprehensive API documentation detailing available metrics, dimensions, request parameters, authentication requirements, and response structures for the Brand Store insights endpoints. Developers building custom reporting tools or third-party integrations can reference these specifications when implementing programmatic data access.
The advertising API requires account identifiers including profileId for sponsored ads accounts, managerAccountId for manager account access, and advertiserAccountId representing DSP advertiser accounts, global account IDs, or Amazon Marketing Cloud instance IDs depending on specific tool requirements.
Request headers must include Amazon-Advertising-API-ClientId containing the application OAuth2 client identifier, Authorization bearer tokens, Amazon-Advertising-API-Scope specifying the target profile, Accept headers defining expected response format versions, and Content-Type declarations specifying request body formats.
Sample API calls demonstrate proper request structure with endpoint URLs, authentication headers, date range parameters, dimension specifications, maximum result limits, and metric arrays listing desired data points. Response examples show typical data structures including dimension identifiers, metric details arrays, score level classifications, date stamps, dwell measurements, recommendation objects, and peer comparison values.
Rate limiting and quota management apply to API requests, though Amazon does not publish specific thresholds publicly. Advertisers building high-frequency data extraction systems should implement exponential backoff retry logic and request throttling to avoid exceeding platform limits that trigger temporary access restrictions.
The API endpoints support POST requests for data retrieval queries but do not accept PUT or PATCH operations for modifying store configurations or quality ratings. The system operates as read-only from an API perspective, with store optimization occurring through the Amazon Ads console interface rather than programmatic manipulation.
Amazon introduced Brand Stores as a premium advertising product providing brands with dedicated storefronts featuring custom design capabilities beyond standard product listing pages. The initial launches focused on major consumer packaged goods brands and large-scale retailers with substantial product catalogs requiring organized presentation.
Early Brand Store implementations offered limited customization options compared to current capabilities. The platform has systematically expanded available widgets, layout templates, interactive elements, and content types over multiple years of iterative development responding to advertiser feedback and competitive pressures from standalone e-commerce platforms.
Video integration represents one significant enhancement trajectory, progressing from static image-only templates to supporting background videos, product demonstration clips, and brand storytelling content. The recommendations engine now explicitly suggests video additions alongside projected impact metrics, reflecting data showing video content's correlation with improved engagement and sales outcomes.
Subpage functionality evolved from simple category navigation to sophisticated multi-level store architectures enabling complex product hierarchies, seasonal collections, promotional campaigns, and educational content sections. Brands operating extensive product lines utilize subpage structures to prevent overwhelming visitors while maintaining comprehensive catalog coverage.
Shoppable image features transform static lifestyle photography into interactive experiences where customers can click products appearing in contextual settings to view details and make purchases. This widget type bridges inspiration-focused brand storytelling with transaction-oriented product discovery, addressing the gap between awareness content and conversion opportunities.
The measurement infrastructure supporting Brand Stores has developed alongside creative capabilities, progressing from basic traffic and sales reporting to sophisticated engagement analytics, attribution tracking, and now sales-based quality ratings incorporating peer comparisons and optimization recommendations.
Subscribe PPC Land newsletter ✉️ for similar stories like this one
Subscribe PPC Land newsletter ✉️ for similar stories like this one
Who: Amazon Advertising updated Brand Store quality rating methodology affecting all advertisers with Brand Stores across 29 countries globally including major markets in North America, South America, Europe, Middle East, and Asia Pacific.
What: The platform replaced engagement-based quality ratings measuring dwell time with sales-based classifications assessing revenue attributed to Brand Store visits within 14-day attribution windows. The system assigns High, Medium, or Low ratings based on sales performance compared to category peer groups while maintaining visibility into engagement metrics like dwell time and bounce rate. API access includes two new parameters PEER_SALES_LAST_60_DAYS and SALES_LAST_60_DAYS enabling programmatic retrieval of sales data.
When: Amazon announced the changes on December 12, 2025, implementing the new methodology immediately for all active Brand Stores without requiring advertiser configuration or opt-in actions.
Where: The feature launched simultaneously across Amazon's global advertising marketplace spanning the United States, Canada, Mexico, Brazil, United Kingdom, Germany, Spain, Italy, France, Belgium, Switzerland, Poland, Netherlands, Sweden, Ireland, Egypt, Turkey, United Arab Emirates, Saudi Arabia, Australia, Japan, India, and Singapore.
Why: The shift reflects industry trends prioritizing business outcomes over engagement proxies, addresses measurement standardization needs across retail media networks, and aligns with Amazon's broader attribution infrastructure expansion throughout 2024 and 2025. Sales-based ratings provide clearer optimization targets for AI-powered campaign management systems while enabling more accurate peer comparisons accounting for category-specific behavioral patterns where engagement duration correlates inconsistently with purchase intent.