Amazon releases new profit analytics dashboard for sellers
Amazon quietly introduced a comprehensive profit analytics dashboard under seller economics on September 18, 2025. The dashboard provides detailed profit reports.

Amazon quietly introduced a comprehensive profit analytics dashboard under seller economics on September 18, 2025. The dashboard provides detailed profit reports.
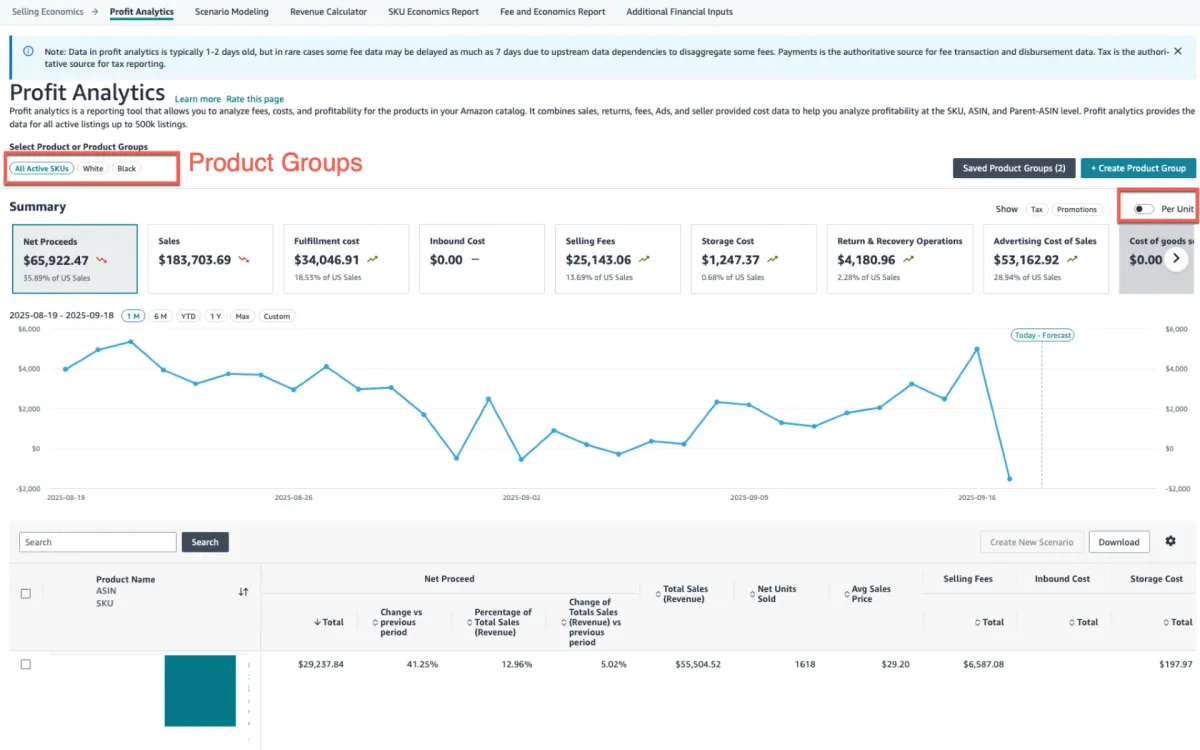
Amazon released its Profit Analytics dashboard on September 18, 2025, under the seller economics reporting section of its marketplace platform. The new tool enables sellers to analyze fees, costs, and profitability for products in their catalog at the SKU, ASIN, and Parent-ASIN level. According to Amazon's documentation, the dashboard combines sales, returns, fees, advertising data, and seller-provided cost data to deliver comprehensive profitability insights.
The dashboard automatically includes all selling fees, referral fees, fulfillment fees, and storage fees. Data in Profit Analytics typically runs 1-2 days behind real-time transactions, though some fee data may delay up to 7 days due to upstream dependencies. The platform provides data for all active listings up to 500,000 listings, positioning it as a scalable solution for large-scale marketplace operations.
Subscribe PPC Land newsletter ✉️ for similar stories like this one. Receive the news every day in your inbox. Free of ads. 10 USD per year.
The analytics tool offers two primary data view types accessible through toggle options in the interface. The "Totals" view provides summed total values for specified data types, while "Unit Economics" delivers totals, per-unit values, and number of units quantities optimized for granular analysis. Users can select from pre-computed time periods to view data with minimal latency, or access downloadable reports for custom time periods or catalogs exceeding 500,000 listings through SKU Economics and Configurable Economics Preview reports.
The dashboard summary section displays key metrics in individual tiles showing Net Proceeds of $65,922.47, Sales of $183,705.69, Fulfillment Cost of $34,046.91, Selling Fees of $25,143.06, Storage Cost of $1,247.37, Return & Recovery Operations of $4,180.96, and Advertising Cost of Sales of $53,162.92. Each metric tile includes percentage calculations relative to total sales, enabling quick profitability assessment.
The interface includes comprehensive filtering options through "Select Product or Product Groups" functionality, allowing analysis of "All Active SKUs," specific product categories like "White" and "Black," or custom product groupings. The system displays data for time periods from August 19 to September 18, 2025, with graphical trend analysis showing daily performance fluctuations.
Inbound costs cover shipping transportation charges, FBA international freight shipping charges, duties and taxes charges, FBA inbound placement service fees, FBA prep fees, and seller-provided shipping, packing, and LTL freight costs. Selling fees include referral fees, per-item selling fees, closing fees, referral fee refunds, and DSTR fees. Storage costs track monthly inventory storage fees, storage utilization surcharges, aged inventory surcharges, AWD processing fees, and seller-provided storage costs.
Amazon's dashboard includes a notable feature for integrating off-platform advertising spend. The system allows sellers to input advertising costs from Meta, TikTok, Google, and other platforms through seller-provided data fields. This integration enables comprehensive profit calculations that include external marketing investments alongside Amazon's native advertising costs from Sponsored Products, Daily Deal fees, Deal Performance Based fees, Coupon Participation fees, and other platform-specific charges.
According to the platform documentation, sellers can provide additional financial inputs through an "Additional Financial Inputs" section. This area accepts cost of goods sold data, total cost per unit, storage cost per unit, shipping costs, packing costs, and LTL freight costs. The system enables sellers to upload spreadsheets containing this financial information directly into the dashboard for integrated profit analysis.
Industry experts expressed significant concerns about Amazon's data collection strategy behind the new dashboard. According to analysis from My Amazon Guy, Amazon's request for off-platform advertising spend represents potential overreach in data aggregation efforts. The concern centers on Amazon's motivation for collecting information about seller advertising investments on competing platforms including Google, Meta, and TikTok.
Amazon historically implemented policies extending its control beyond the marketplace platform. Earlier in 2025, the company introduced policies enabling suppression of Amazon listings based on claims made on seller websites. This precedent raised concerns about how Amazon might utilize off-platform advertising data to influence marketplace operations or competitive positioning.
The skepticism extends to Amazon's track record with seller relationships. According to industry commentary, many Amazon sellers operate under the principle that sharing sensitive business data with Amazon creates unnecessary risks. The platform's dual role as both marketplace facilitator and direct competitor through Amazon Basics and private label products amplifies these concerns about data sharing.
The dashboard excludes several fee categories from its profit calculations. Subscription fees, selling account services fees, unplanned service fees, rental book service fees, high-volume listing fees, Prime Wardrobe costs, and other less common fees remain outside the profit analytics scope. This limitation means sellers must account for these additional costs separately when calculating comprehensive profitability.
Amazon notes that estimated net proceeds and percentage of Gross Merchandise Sales visible in Profit Analytics represent estimates dependent on seller-provided inputs. When sellers choose to provide additional financial inputs, estimated net proceeds in Profit Analytics may differ from net proceeds in other Amazon reports that exclude these costs. The platform calculates net proceeds estimates at product level and aggregates them into catalog summaries.
The system offers interactive functionality enabling sellers to click summary metric tiles to view breakdowns of components in lower tables. A settings icon allows customization of displayed fields, while search functionality enables product-specific analysis by SKU, ASIN, or product name. Sort functionality arranges data by highest or lowest values across any metric column.
Buy ads on PPC Land. PPC Land has standard and native ad formats via major DSPs and ad platforms like Google Ads. Via an auction CPM, you can reach industry professionals.
Amazon's recent transparency initiatives included introducing pricing transparency reports for its demand-side platform in response to European Union Digital Markets Act requirements. The profit analytics dashboard represents an extension of these reporting capabilities, though focused on seller-provided data rather than regulatory compliance.
The timing coincides with increased regulatory scrutiny of Amazon's business practices. Privacy advocates have raised concerns about Amazon's data collection practices, particularly regarding cross-service data sharing and consent mechanisms. These regulatory challenges create additional context for seller concerns about sharing sensitive business information with the platform.
Amazon's broader technological initiatives include advanced AI capabilities across seller platforms, which rely on comprehensive data collection to deliver personalized recommendations and automated optimizations. The profit analytics dashboard appears aligned with these AI-driven initiatives, potentially providing data inputs for future automated business recommendations.
The profit analytics dashboard launch reflects Amazon's strategy of providing value-added services while simultaneously collecting competitive intelligence. By encouraging sellers to upload off-platform advertising spend, Amazon gains visibility into competitor marketing investments and budget allocations across the digital advertising landscape.
This data collection strategy aligns with Amazon's historical approach to seller relationships. The company frequently leverages seller data to inform its own product development decisions, competitive pricing strategies, and marketplace policies. The profit analytics dashboard extends this data collection into previously private areas of seller operations including manufacturing costs, shipping expenses, and multi-platform advertising strategies.
Alternative profitability tracking solutions exist in the marketplace, including Sellerboard and MerchantSpring, which provide similar analytics without requiring data sharing with Amazon. These third-party tools enable profit tracking across multiple channels while maintaining data privacy and avoiding potential conflicts of interest inherent in Amazon's dual role as platform and competitor.
The dashboard's comprehensive scope suggests Amazon's intention to position itself as the primary business intelligence platform for marketplace sellers. This positioning could reduce seller reliance on third-party analytics tools while increasing Amazon's access to sensitive business metrics across its seller ecosystem.
Amazon implemented the Profit Analytics dashboard without advance notice to sellers, following its typical pattern of rolling out new features without extensive consultation periods. The dashboard appears in the seller economics section of Amazon's reporting interface, alongside existing financial reports and fee breakdowns.
Initial seller reception appears mixed based on marketplace forum discussions. While sellers appreciate enhanced visibility into profit metrics, concerns about data sharing requirements limit adoption of the dashboard's advanced features. The optional nature of additional financial inputs means sellers can utilize basic functionality without sharing sensitive business information.
The implementation strategy reflects Amazon's broader approach to seller tool adoption, where basic functionality remains accessible while advanced features require additional data sharing commitments. This tiered approach enables Amazon to collect varying levels of business intelligence while maintaining seller engagement across different risk tolerance levels.
The profit analytics dashboard operates on Amazon Web Services infrastructure, leveraging the same systems that power Amazon's broader marketplace operations. According to platform documentation, data processing occurs within Amazon's existing seller data management systems, subject to standard seller agreement terms and conditions.
The platform's ability to handle up to 500,000 listings demonstrates significant technical capacity for large-scale data processing and analysis. This scalability positions the dashboard as suitable for enterprise-level sellers managing extensive product catalogs across multiple categories and marketplaces.
Integration with existing Amazon advertising systems enables automated collection of Sponsored Products data, eliminating manual data entry requirements for platform-native advertising costs. This integration reduces administrative overhead while ensuring accurate advertising cost attribution within profit calculations.
The profit analytics dashboard represents a significant development in Amazon's data collection strategy and its relationship with marketplace sellers. By providing valuable analytics tools while requesting sensitive business information, Amazon creates a value exchange that benefits both parties while advancing its competitive intelligence capabilities.
For sellers, the dashboard offers unprecedented visibility into comprehensive profit metrics within Amazon's native interface. This integration eliminates the need for complex data exports and third-party analysis tools while providing real-time insights into business performance across multiple cost categories.
The long-term implications extend beyond immediate profit analysis capabilities. Amazon's access to comprehensive seller cost data could inform future fee structures, policy decisions, and competitive strategies across the marketplace ecosystem. This data collection represents a strategic investment in business intelligence that could influence Amazon's marketplace operations for years to come.
Subscribe PPC Land newsletter ✉️ for similar stories like this one. Receive the news every day in your inbox. Free of ads. 10 USD per year.
Subscribe PPC Land newsletter ✉️ for similar stories like this one. Receive the news every day in your inbox. Free of ads. 10 USD per year.
Who: Amazon marketplace sellers using the seller economics reporting section gain access to comprehensive profit analytics capabilities.
What: Amazon released a profit analytics dashboard combining sales data, fees, advertising costs, and seller-provided financial inputs to calculate comprehensive profitability metrics at SKU, ASIN, and Parent-ASIN levels.
When: The dashboard became available on September 18, 2025, without advance notice to sellers.
Where: The feature appears in Amazon's seller economics section across all marketplace regions, supporting up to 500,000 active listings per account.
Why: Amazon aims to provide enhanced business intelligence tools for sellers while collecting comprehensive data about off-platform advertising spend, manufacturing costs, and shipping expenses to inform competitive strategies and platform development decisions.