Australia's internet ad market hits $18.4bn - but not all formats won
Australia's internet advertising market grew 11.5% to $18.4bn in 2025, with video surging 19.8% and social video up 35.1%, per IAB Australia and PwC data.

Australia's internet advertising market grew 11.5% to $18.4bn in 2025, with video surging 19.8% and social video up 35.1%, per IAB Australia and PwC data.

Australia's internet advertising market reached $18.4 billion for the full calendar year 2025, growing 11.5% year-on-year - marking the second consecutive year of double-digit growth, according to the IAB Australia Internet Advertising Revenue Report (IARR) compiled by PwC Australia and released on 2 March 2026. The data provides the marketing community with a detailed picture of where spending flowed, and where it did not.
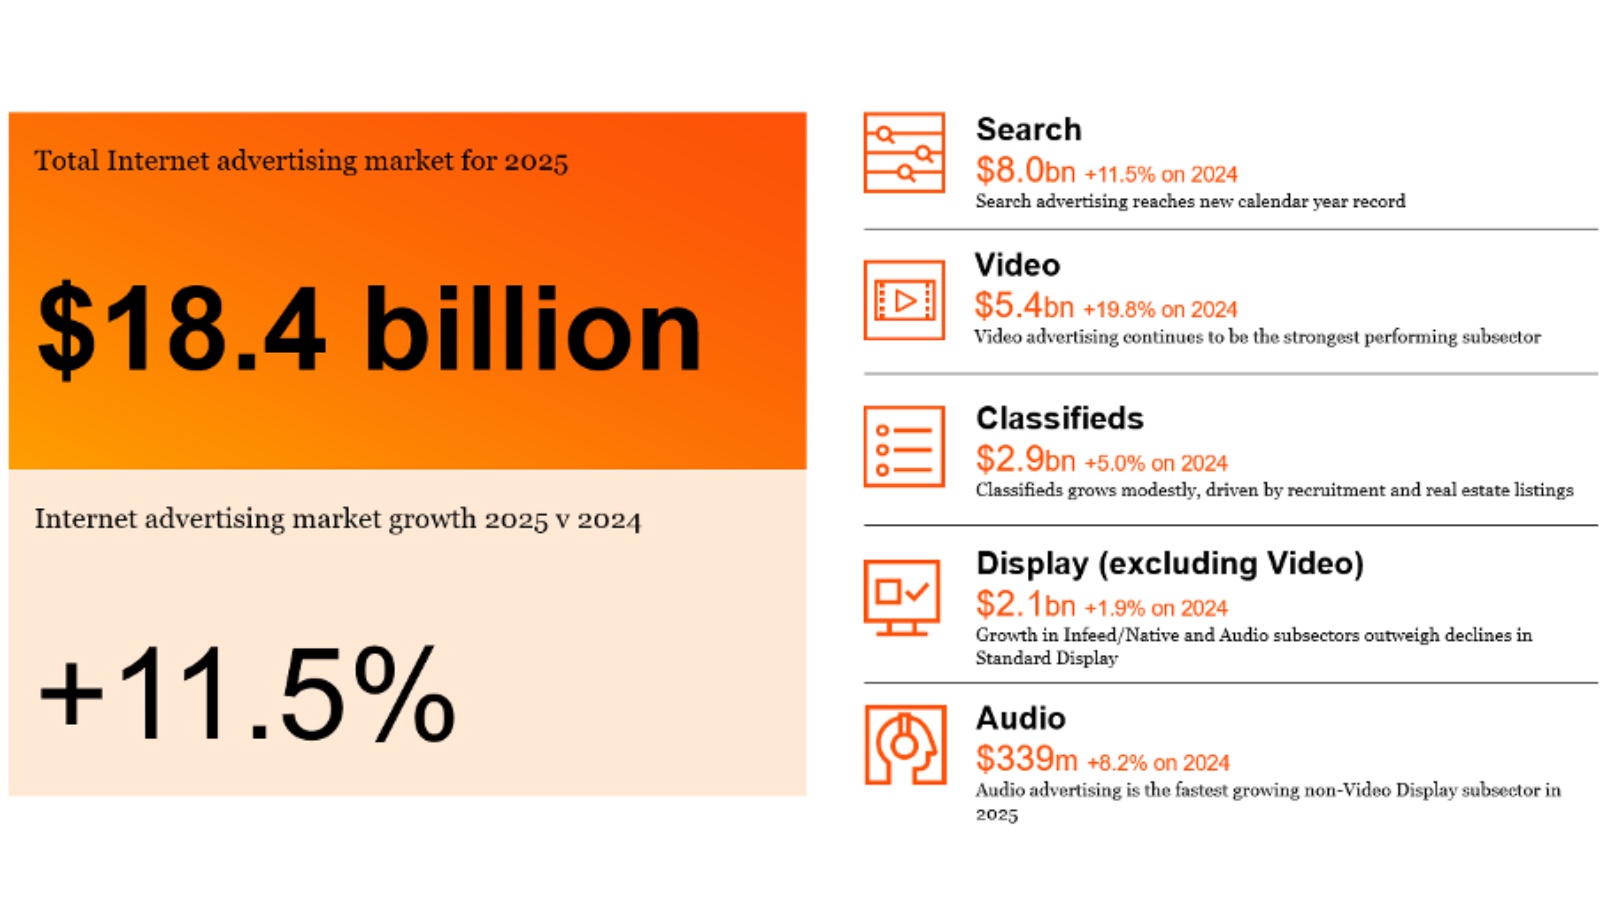
The headline number masks significant divergence across formats. Video advertising delivered the standout result - up 19.8% year-on-year to reach $5.4 billion - while non-video display crept forward just 1.9% to $2.1 billion. Search held firm at $8.0 billion, also growing 11.5%, recording a new annual record. Classifieds expanded 5.0% to $2.9 billion, driven by recruitment and real estate listings. Audio rounded out the categories at $339 million, up 8.2%, with podcast growth outrunning streaming.
That two-speed market - video and search pulling ahead, standard display lagging - is a pattern PPC Land has tracked across multiple Australian reporting cycles. The September 2024 quarter already pointed in this direction, with video investment propelled by Olympics-related spend. The full-year 2025 result confirms the trajectory is structural, not seasonal.
Within video's $5.4 billion total, the internal composition shifted sharply during 2025. Social video - comprising ads on Meta platforms, TikTok, Snapchat, Pinterest, LinkedIn, and X - accounted for 40% of total video investment for the calendar year, reaching $2.2 billion and growing 35.1% year-on-year. Other video (YouTube, SBS On Demand, Foxtel, short-form editorial, and similar environments) contributed $2.7 billion, up 12.2%. BVOD video - broadcaster video-on-demand across 7Plus, 9Now, and 10Play - came in at $0.5 billion, growing 7.1%, the slowest segment within video.
Social video's share of total video increased by four percentage points compared to 2024. That gain comes at some cost to traditional broadcaster environments. For media buyers focused on brand-safe, premium contexts, the data raises questions about where video budgets are being allocated versus where audiences are consuming content.
Connected TV continued its longer-term expansion, with its share of content publishers' video inventory reaching 57% for the calendar year - up from 51% in 2024 and 50% in 2023. Mobile accounted for 30% of that inventory, while desktop fell to 13%, its lowest share in the reported historical data. The CTV trajectory is consistent with IAB Australia's video measurement framework published in December 2025, which identified CTV as the most rapidly evolving segment requiring standardized measurement approaches.
Search advertising at $8.0 billion represents 43.8% of total internet advertising expenditure in Australia for 2025 - a share virtually unchanged from 43.7% in 2024. The category has held between 43% and 45% of total spend every year since 2019, according to the report data. That stability reflects search's role as a direct-response channel with reliable return on investment calculations; advertisers have maintained commitment even as brand-building formats like video attracted incremental budget.
Search also exceeded $2 billion for three consecutive quarters during the year. In the December 2025 quarter alone, search reached $2,080 million, up 13.4% on December 2024. For the full year, the compound annual growth rate for search since 2019 stands at 11.4%, according to the report - robust and consistent, though below video's 21.8% CAGR over the same period.
The report covers both the calendar year and the December 2025 quarter specifically. Total internet advertising expenditure for the December quarter reached $4.9 billion, up 14.4% compared to the December 2024 quarter. That acceleration from the full-year rate of 11.5% reflects the seasonal weight of retail spending into the fourth quarter.
The report confirms that 52% of total 2025 internet advertising expenditure occurred in the second half of the year, a pattern consistent with prior years. In absolute terms, the second half of 2025 generated $9.5 billion compared to $8.8 billion in the first half.
Breaking down the December quarter: video reached $1,510 million (up 15.4%), search hit $2,080 million (up 13.4%), classifieds came in at $733 million (up 21.2% - the strongest category growth for the quarter), display excluding video was $592 million (up 8.3%), and audio reached $94 million (up 5.1%).
The classifieds result for the December quarter deserves attention. A 21.2% year-on-year increase, driven by recruitment, real estate, and automotive subsectors, suggests labor market activity and property transactions remained elevated through the end of 2025. PPC Land previously reported on Q3 2024 classifieds patterns showing resilience in the category, and the December 2025 data reinforces that view.
For content publishers' general display inventory, agency buying via insertion order increased its share during 2025, rising to 46% from 44% in 2024 and 45% in 2023. Direct buying fell to 15% from 17%, while programmatic guaranteed held at 14%. Programmatic RTB/PMP remained at 25%.
The December 2025 quarter showed a different picture for video specifically. According to the report, 58% of content publishers' video inventory was bought programmatically in the December quarter, regaining share from agency (via IO). Looking at the detailed breakdown for the quarter: for standard display, agency via IO dominated at 53%; for infeed/native, programmatic (RTB/PMP) led at 73%; for video, agency via IO was 39%, programmatic RTB/PMP at 35%, programmatic guaranteed at 23%, and direct just 3%.
The seasonal sporting season in the peak Australian broadcast calendar contributed to agency IO gaining ground during certain 2025 periods, as high-demand content environments favour direct-negotiated deals. This buying method interplay matters for programmatic advertising practitioners, who navigate between automated efficiency and premium inventory access.
The audio market, at $339 million for the full year, sits at 4.5% of total general display advertising expenditure. Within that total, podcast advertising reached $134 million, up 13.5% year-on-year. Streaming audio came in at $205 million, growing 5.0%. Podcasting's faster growth rate - more than double that of streaming audio - is consistent with the audience shift towards long-form on-demand audio content.
For the December quarter, total audio reached $94.2 million, approaching the $100 million quarterly threshold. Podcast spend for the quarter was $35.8 million (up 6.5% on December 2024), streaming $58.4 million (up 4.3%). Both subsectors grew against the prior year comparative quarter.
The audio result sits within a broader IAB Australia focus on digital audio measurement and standards. IAB Australia released alcohol advertising compliance guides for digital audio in August 2025, reflecting the category's growth as an advertising medium requiring its own regulatory frameworks.
The report's industry category data covers reported general display advertising from content publishers - notably excluding Meta, Google, X, Snapchat, Spotify, TikTok, Pinterest, Amazon, LinkedIn, and Foxtel general display advertising. With that scope in mind, the top five categories for the full calendar year 2025 were retail (17.5% share), automotive (13.3%), entertainment & media (10.0%), finance (8.7%), and FMCG (6.3%).
Retail maintained its position as the leading category for the fifth consecutive year. But the directional movements are instructive. Finance increased its share from 8.0% in 2024 to 8.7% in 2025 - a gain of 0.7 percentage points. Insurance added 1.2 percentage points to reach 4.3%. Automotive, by contrast, fell 1.5 percentage points from 14.8% to 13.3%, and entertainment & media dropped 1.4 percentage points from 11.4% to 10.0%.
For the December 2025 quarter specifically, retail strengthened further to 19.8% of reported general display - up from 17.3% in December 2024. Telecommunications recorded the largest gain for the quarter, adding 1.8 percentage points. Technology fell 2.2 percentage points to 2.5%.
Looking at video advertising preferences, FMCG and home products categories showed the strongest over-indexing towards video relative to their general display share. FMCG's share of 2025 video spend (8.6%) exceeded its general display share (6.3%) by 2.3 percentage points. Home products similarly over-indexed by 1.6 percentage points. Real estate, conversely, under-indexed video by 3.4 percentage points, reflecting the format's lesser relevance for property search contexts.
Social display and video combined - encompassing all display formats on Meta platforms, TikTok, Snapchat, Pinterest, LinkedIn, and X - reached 17.6% of total internet advertising expenditure for calendar year 2025, up from 16.0% in 2024. In absolute terms, this represents $3.2 billion. Non-social display and video, at 21.2%, declined from 21.8%.
For the December 2025 quarter, social display and video accelerated to 19.5% of the total market ($957 million for the quarter), up from 17.8% in December 2024. The trajectory suggests social platforms are on course to approach parity with non-social display and video within a few quarters if current growth rates persist.
Gai Le Roy, CEO of IAB Australia, commented on the full-year results: "The 2025 results show a market that is growing, but selectively. Overall investment increased strongly, driven primarily by video and search, while other display environments saw more modest movement. Social video and podcasting continue to outperform the market."
Le Roy also highlighted the changing advertiser base: "While the large media agencies remain important drivers of scale, we're also seeing strong investment from independent agencies, high-growth brands managing their own media, and SMEs. Established advertisers continue to expand in-house capability, and we're seeing increased investment from Chinese and other international brands seeking to connect with Australian audiences."
That shift in advertiser composition has structural implications. If the growth in direct-to-market brands and international entrants continues, it could reshape the balance between agency insertion orders and programmatic buying channels over coming years.
The historical data in the report provides perspective on the pace of market expansion. Australia's internet advertising market stood at $9.3 billion in 2019. It contracted 3.7% in the pandemic year of 2020 to $9.6 billion, before recovering sharply to $13.0 billion in 2021 (a 36% jump). Growth moderated to 9.1% in 2022 ($14.2 billion) and slowed further to 3.7% in 2023 ($14.7 billion), before accelerating again to 12.2% in 2024 ($16.5 billion) and 11.5% in 2025 ($18.4 billion).
Video's compound annual growth rate since 2019 stands at 21.8%, compared to 11.4% for search, 9.5% for classifieds, and just 2.3% for display (excluding video). The divergence confirms a long-running structural shift in advertising format preferences, not merely a short-term trend. PPC Land reported on the FY25 mid-year figures in September 2025, when the 12-month total reached $17.2 billion - the December half-year data now adds approximately $1.2 billion to that running total.
The IARR is compiled by PwC Australia on behalf of IAB Australia, drawing on expenditure data submitted directly by participating companies. Data capture for the IARR commenced in the March 2002 quarter. Figures are based on gross commissionable advertising revenue - the amounts charged to the advertiser before agency rebates. The report does not constitute an audit under Australian Auditing Standards. For platforms including Meta, Google, TikTok, Amazon, Spotify, LinkedIn, Pinterest, Snapchat, X, and Foxtel, which do not disclose revenues by geography or product line, estimates are developed through earnings analysis, research firm data, and interviews with agency and publisher executives.
Contributors to the report's verified data include Acast, ARN Media, carsales.com, Daily Mail Australia, Domain, The Guardian, MamaMia, News Corp Australia, Nine, Paramount, REA Group, SBS, Seek, Seven West Media, Triton Digital, and Yahoo.
Who: IAB Australia, in collaboration with PwC Australia, compiled and released the data. The report's findings were commented on by Gai Le Roy, CEO of IAB Australia. Data contributors include major Australian media companies and digital publishers; platforms including Meta, Google, TikTok and others were incorporated via PwC estimates.
What: The IAB Australia Internet Advertising Revenue Report for calendar year 2025 and the December 2025 quarter shows the Australian internet advertising market reached $18.4 billion for the full year 2025, growing 11.5% year-on-year. Video grew 19.8% to $5.4 billion; search grew 11.5% to $8.0 billion; classifieds grew 5.0% to $2.9 billion; display excluding video grew 1.9% to $2.1 billion; audio grew 8.2% to $339 million. The December 2025 quarter alone reached $4.9 billion, up 14.4%.
When: The report covers the calendar year ended 31 December 2025 and the quarter ended 31 December 2025. It was released on 2 March 2026 by IAB Australia.
Where: The report covers the Australian internet advertising market. The report was prepared by PwC Australia and published by IAB Australia, the peak trade association for online advertising in Australia.
Why: The IARR is an ongoing industry measurement initiative designed to provide an accurate barometer of internet advertising expenditure growth in Australia. For the marketing community, the data matters because it confirms the shift of advertising budgets toward video - particularly social video and connected TV - while highlighting that non-video display formats are growing more slowly than the broader market. The finance and insurance categories are gaining display share; automotive and entertainment are losing it. Agency insertion-order buying is reclaiming share from direct buying, while programmatic remains dominant in video. These signals affect budget allocation, platform strategy, and measurement priorities for advertisers and agencies operating in the Australian market.