Google Analytics expands benchmarking to include absolute metrics
Google Analytics now offers benchmarking for 20 unnormalized metrics like total revenue and new users, estimating performance ranges based on active user counts.

Google Analytics now offers benchmarking for 20 unnormalized metrics like total revenue and new users, estimating performance ranges based on active user counts.
Google Analytics rolled out a significant expansion to its benchmarking capabilities on October 2, 2025. The platform now supports comparisons for 20 additional unnormalized metrics—absolute numbers such as "New users" and "Total Revenue"—marking a shift from its previous focus solely on normalized metrics like percentages and ratios.
The benchmarking feature allows businesses to compare their performance against peer groups within their industry category. These peer groups are determined through a combination of factors, including the broad industry category selected during setup and signals from property URLs and app attributes. The system offers benchmarks in three percentiles: median, 25th, and 75th, providing businesses with a range to assess their relative standing.
Subscribe PPC Land newsletter ✉️ for similar stories like this one. Receive the news every day in your inbox. Free of ads. 10 USD per year.
Google first introduced its benchmarking tool on October 28, 2024, initially limited to normalized metrics. That launch enabled encrypted data comparison across industry peer groups while maintaining data privacy and security through aggregation protocols. The October 2 update extends this functionality to address a more complex measurement challenge: how can businesses of vastly different sizes meaningfully compare absolute performance numbers?
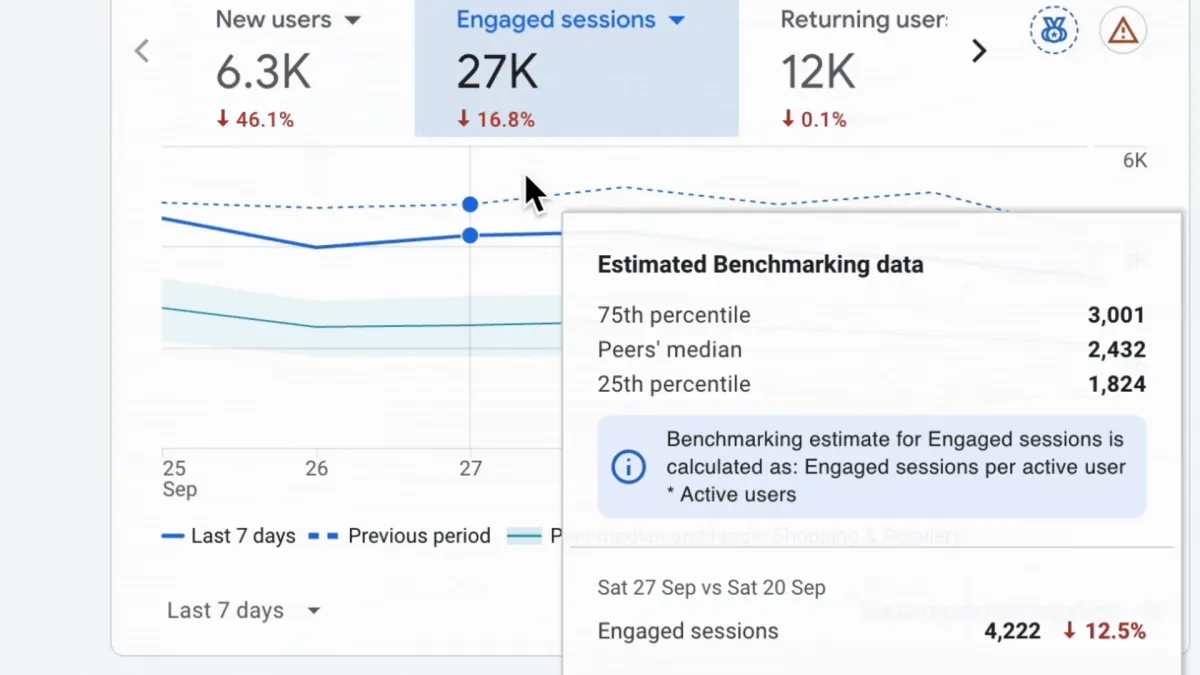
A small business with 1,000 active users cannot directly compare its total revenue to a large enterprise with 100,000 active users. The October 2 solution addresses this disparity through estimation. Google Analytics calculates a performance range tailored to each property's scale by multiplying the peer group's normalized metric by the individual property's active user count. The formula for benchmarking "Engaged Sessions," for example, is: Benchmarking estimate (Engaged Sessions) = Peer group's Engaged sessions per active user × Property's Active users.
This methodology allows businesses to compare their absolute performance to peers in a way that accounts for differences in traffic volume. The system essentially asks: given your current active user base, how does your total revenue or new user count compare to what similar businesses achieve with similar traffic levels?
The Active users metric is an exception to this estimation approach. Instead of using a normalized metric calculation, the system uses actual active user counts from peers in the group. This provides a direct comparison of audience size rather than an estimate based on other factors.
Google Analytics offers benchmarks across 25 major industry categories, from Arts & Entertainment to Travel & Transportation. Each category contains numerous subcategories enabling more granular comparisons. A business in the apparel sector, for instance, can select Shopping > Apparel > Footwear > Athletic shoes for the most relevant peer comparison. Properties must have the "Modeling contributions & business insights" setting enabled in Admin > Account Settings to access benchmarking data.
The benchmarking data appears on overview cards throughout the Google Analytics interface. When activated, the card displays three data elements: the property's trendline as a solid line, the median for the peer group as a dotted line, and the peer group range as a shaded area. The range spans from the 25th to 75th percentile, providing context for whether performance falls below, within, or above the typical range for similar businesses.
Data privacy remains a central concern. Properties must meet minimum volume requirements for users and meaningful data generation to participate in peer groups and contribute to benchmarking metrics. Thresholds ensure a minimum number of properties are included before benchmarks become available to a peer group. The system encrypts and aggregates all data, ensuring individual property information remains protected. Benchmarking data refreshes every 24 hours.
The expansion to unnormalized metrics creates new analytical possibilities across business models. An e-commerce business can now benchmark "Total Revenue" against peers at similar traffic levels. A B2B services company can evaluate whether its "Engaged Sessions" count falls within the expected range for businesses with comparable active user bases. A mobile games company can assess whether it generates more or fewer engaged sessions than competitors of similar size.
Buy ads on PPC Land. PPC Land has standard and native ad formats via major DSPs and ad platforms like Google Ads. Via an auction CPM, you can reach industry professionals.
For marketers managing paid campaigns, the benchmarking expansion provides clearer context for evaluating campaign ROI. The marketing community has increasingly focused on measurement accuracy and cross-platform attribution, particularly as privacy changes fragment traditional tracking methods. Industry experts emphasize that combining multiple measurement approaches—including benchmarking, attribution, and experimentation—delivers the most accurate picture of advertising performance.
Google has systematically expanded Google Analytics capabilities throughout 2025. On August 25, the platform improved ecommerce data availability and usability, expanding access to item-scoped dimensions and metrics while enhancing match type support. Cost data import capabilities expanded significantly on June 24, adding support for Google Sheets, Amazon Redshift, Amazon S3, BigQuery, Google Cloud Storage, HTTPS, MySQL, PostgreSQL, and Snowflake.
The platform also enabled direct integration with social advertising platforms, including Reddit Ads on July 21, Snap Ads on September 17, and Pinterest Ads on September 26. These integrations eliminate manual data import processes while enabling unified campaign measurement across advertising channels.
On July 22, Google Analytics launched specialized reports for lead generation customers, introducing Lead Acquisition and Lead Disqualification and Loss reports alongside eight new audience templates. The platform also released an experimental Model Context Protocol server on the same date, enabling natural language queries through AI assistants like Gemini.
AI-powered features expanded on April 2 with Generated insights, which provide plain-language explanations of data fluctuations directly within detailed reports. The system analyzes complex data patterns to explain why metrics like "Purchase" events spike, presenting findings in accessible language rather than requiring manual analysis.
The benchmarking expansion arrives as the broader analytics industry grapples with measurement challenges. Research published in March 2025 by the Institute of Practitioners in Advertising emphasized that no single measurement approach addresses all challenges. Marketing mix modeling excels at understanding long-term effects but lacks granularity. Attribution delivers detailed performance metrics but struggles with privacy constraints. Experimentation provides causal clarity but can be expensive to implement at scale.
Benchmarking fills a specific gap in this measurement ecosystem by providing competitive context. Businesses can identify whether performance gaps stem from internal execution issues or reflect broader industry patterns. A business performing at the 25th percentile for "New User Rate" relative to peers faces a different strategic challenge than one performing at the 75th percentile but still missing internal targets.
Platform stability has occasionally challenged Google Analytics users throughout 2025. On July 17, the platform experienced a comprehensive outage affecting all features globally, leaving digital marketers unable to access analytics data during critical business hours. Users encountered HTTP 500 internal server errors, with the platform displaying "There was an error. Please try again later" messages.
The documentation provides six sample scenarios illustrating how businesses can apply benchmarking insights across different metrics and industries. For acquisition analysis, a Shopping > Apparel business with "New User Rate" consistently below the 25th percentile might increase investment in user acquisition strategies like targeted advertising or content marketing. For engagement analysis, an Arts & Entertainment property with "Average Engagement Time per Session" significantly higher than the 75th percentile might capitalize on this engagement by introducing conversion strategies.
For retention analysis, a Travel & Transportation business with "Bounce Rate" notably higher than the peer median might investigate reasons and improve user experience or optimize landing pages. For monetization analysis, a Food & Drink business with "ARPU" trending below the 25th percentile might explore upselling, cross-selling, loyalty programs, or personalized offers.
The system includes feedback mechanisms allowing users to indicate whether surfaced benchmarks prove helpful through thumbs-up and thumbs-down buttons. This input informs which benchmarks the platform surfaces in future iterations. The feature is unavailable when the date range is set to "today" and works with the majority of metrics, though it remains unavailable for custom metrics and a small number of specific standard metrics. Data availability extends back to May 30, 2024.
The peer group system determines industry categorization through multiple signals beyond the initially selected category. URL patterns, app attributes specified in data streams, and other property characteristics contribute to peer group assignment. This multi-factor approach aims to create more accurate groupings than relying solely on self-reported industry categories.
The benchmarking feature operates within Google Analytics' broader data processing infrastructure. Data undergoes the same privacy and quality controls applied to other Analytics features, including data sampling thresholds and aggregation requirements. The system processes data at the property level, meaning businesses with multiple properties must configure benchmarking separately for each.
Integration with other Google advertising and measurement platforms remains limited to data sharing through standard Analytics mechanisms. Benchmarking data does not automatically flow into Google Ads or other platforms, though businesses can use insights to inform campaign strategies across channels.
The expansion to unnormalized metrics represents a technical achievement in comparative analytics. Calculating meaningful benchmarks for absolute numbers while accounting for scale differences requires sophisticated data processing and normalization. The system must maintain accuracy while protecting individual property data and meeting minimum threshold requirements for peer group formation.
Industry trends suggest continued emphasis on competitive intelligence within analytics platforms. LinkedIn introduced company-level attribution capabilities on July 28, enabling B2B marketers to track campaign influence from first touch to closed deals. The platform's Revenue Attribution Report connects advertising activities to revenue outcomes rather than proxy metrics, addressing the 78% of B2B CMOs who say proving ROI has become more important.
Measurement methodology debates continue across the industry. Research from Kochava announced on September 23 found that marketing mix modeling revealed TikTok campaigns generated an average of 35% higher incremental impact compared to last-touch attribution reporting. The study analyzed major Android and iOS applications across North America during the first quarter of 2025.
For businesses implementing benchmarking, establishing baseline measurements before making strategic changes provides clearer impact assessment. Comparative analysis offers the most reliable methodology for understanding performance shifts. The system serves as a diagnostic tool rather than a prescription—businesses performing above the 75th percentile may still find improvement opportunities by analyzing what top performers do differently.
The October 2 update continues Google Analytics' trajectory toward more comprehensive measurement capabilities that balance technical sophistication with accessibility. The platform aims to provide businesses of all sizes with tools previously available only through custom analytics implementations or expensive third-party solutions.
Subscribe PPC Land newsletter ✉️ for similar stories like this one. Receive the news every day in your inbox. Free of ads. 10 USD per year.
Subscribe PPC Land newsletter ✉️ for similar stories like this one. Receive the news every day in your inbox. Free of ads. 10 USD per year.
Who: Google Analytics users with properties that meet minimum traffic and data quality thresholds can access the expanded benchmarking feature. Businesses across 25 major industry categories, from e-commerce to B2B services, can leverage the new capabilities.
What: Google Analytics added benchmarking support for 20 unnormalized metrics—absolute numbers like "New users" and "Total Revenue"—expanding beyond the previously available normalized metrics. The system estimates performance ranges by multiplying peer group normalized metrics by individual property active user counts, enabling meaningful comparisons that account for traffic volume differences.
When: The feature launched on October 2, 2025, building on the original benchmarking tool introduced on October 28, 2024. Benchmarking data is available from May 30, 2024 onwards, refreshing every 24 hours.
Where: The benchmarking feature is accessible on the Overview card on the Google Analytics home page. Data displays through trendlines, peer medians, and percentile ranges (25th to 75th). The feature operates across 25 major industry categories with numerous subcategories, requiring the "Modeling contributions & business insights" setting enabled in account settings.
Why: The expansion allows businesses to compare absolute performance metrics against industry peers while accounting for differences in traffic volume and scale. This provides more relevant competitive context than raw number comparisons alone, helping businesses identify whether performance gaps stem from internal execution or reflect broader industry patterns. For marketing professionals managing paid campaigns, the feature offers clearer context for evaluating campaign ROI against industry standards, particularly important as privacy changes fragment traditional tracking methods and measurement accuracy becomes increasingly critical.