Google Search Console adds weekly and monthly aggregation views
Google Search Console adds weekly and monthly data in Performance reports, addressing misaligned date comparison issues for website owners.

Google announced on December 10, 2025, a new granularity selector for the Search Console Performance report that allows website owners to view traffic data aggregated by week or month rather than the default daily breakdown. The update addresses persistent challenges in trend analysis where daily fluctuations obscure longer-term patterns affecting search visibility.
According to the announcement, "Analyzing search traffic trends is a core part of SEO. While granular, daily data is essential for spotting immediate issues or spikes, it can sometimes be harder to understand the bigger picture. Daily fluctuations can make it hard to see if your site is truly growing or declining over time."
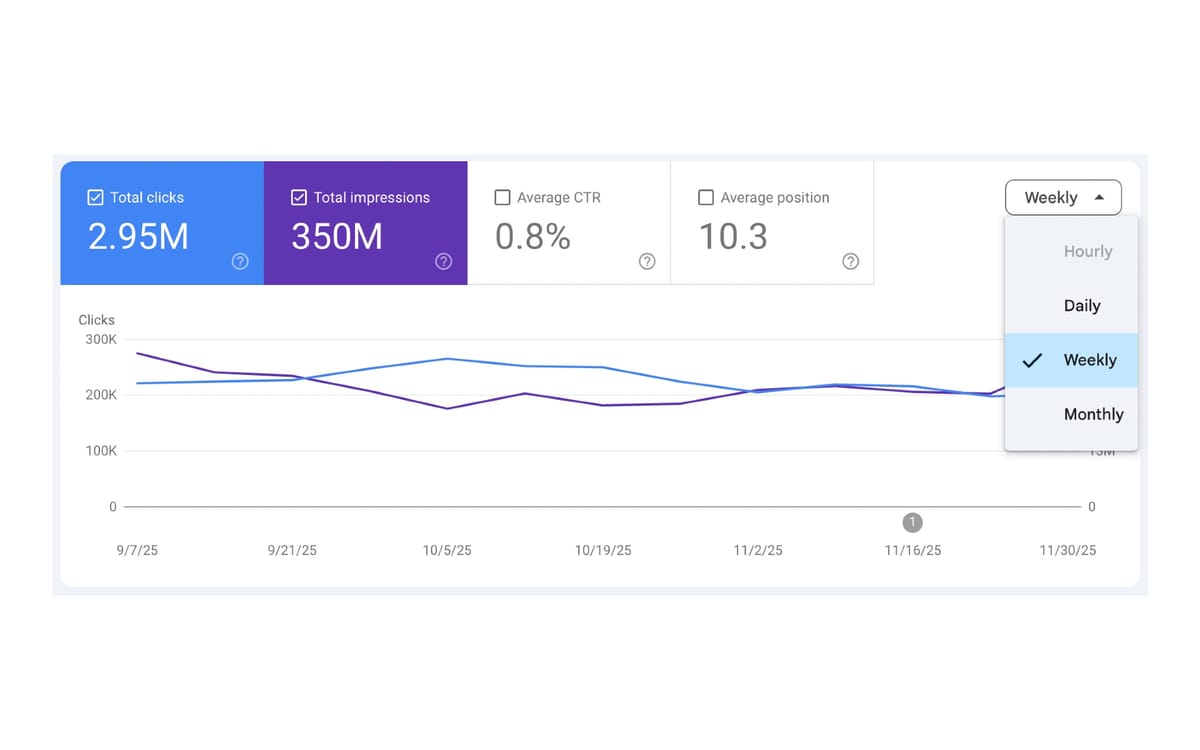
The Performance report charts previously displayed exclusively daily data. Website owners now access weekly and monthly aggregation options through a dropdown selector labeled "Daily" within the chart area. The functionality applies to Search results, Google News, and Discover performance data.
Moshe Samet, Product Manager Lead for Search Console, announced the rollout through Google Search Central's blog. The new granularity options deploy globally to all Search Console properties starting December 10, with immediate availability for users accessing the platform.
The granularity selector operates through a dropdown menu positioned in the chart area of the Performance report. Users click the dropdown defaulting to "Daily" and select either weekly or monthly views. The chart updates immediately to reflect the chosen aggregation level.
Google designed the feature specifically for date range comparisons. According to the announcement, comparing "Last 3 months" to "Previous 3 months" creates interpretation difficulties when daily data misaligns due to weekend variations. Monthly aggregation eliminates day-of-week discrepancies that complicate period-over-period analysis.
The company modified export file structures to accommodate the new aggregation options. Users exporting data encounter changes to file names, tab names, column headers, and sort order that align with the selected granularity level. The adjustments ensure exported data matches the aggregation selected in the interface.
Performance metrics remain consistent across aggregation levels. Total clicks, total impressions, average click-through rate, and average position calculate based on the selected time period. Weekly views aggregate seven-day periods while monthly views consolidate full calendar months.
The weekly and monthly views directly address a technical challenge affecting Search Console comparison functionality. When comparing three-month periods, the previous period rarely aligns on matching days of the week with the current period. Mondays in the current period compare against Thursdays or Fridays in the previous period, creating pattern distortions.
Weekend traffic differs substantially from weekday traffic for most websites. E-commerce properties typically experience higher weekend conversion rates, while business-to-business sites see weekday concentration. Daily comparisons between misaligned periods introduce artificial variance unrelated to actual performance changes.
Weekly aggregation resolves the misalignment problem. Each week contains the same distribution of weekdays and weekends, creating consistent comparison units. Month-over-month comparisons using monthly aggregation eliminate day-of-week effects entirely.
Search Console's Performance report already supported custom date ranges, comparison modes, and various filters. The platform added comparison mode for 24-hour data on July 16, 2025, expanding temporal analysis capabilities. The weekly and monthly aggregation options extend this progression toward flexible time-based analysis.
Buy ads on PPC Land. PPC Land has standard and native ad formats via major DSPs and ad platforms like Google Ads. Via an auction CPM, you can reach industry professionals.
The granularity selector applies uniformly across all Performance report charts. Users analyzing search type performance, query performance, page performance, country performance, device performance, or search appearance data access the same weekly and monthly options.
Filter combinations work independently of granularity selection. Website owners can apply query filters, page filters, country filters, device filters, and search appearance filters while viewing weekly or monthly data. The aggregation operates on the filtered dataset rather than constraining filter capabilities.
The system calculates weekly aggregations using calendar weeks. According to standard implementations, weeks begin on Sunday and end on Saturday. Partial weeks at the start or end of date ranges receive aggregation based on available days rather than extending into unavailable periods.
Monthly aggregations follow calendar months regardless of the number of days. February aggregates 28 or 29 days depending on the year, while months with 31 days aggregate the complete period. The system does not normalize monthly data to account for varying month lengths.
Position calculations average across the aggregation period. Daily position values within a week or month combine to produce the reported average position for that period. This methodology matches how Search Console calculates average position across any multi-day date range.
Search Console Insights, which Google integrated into the main interface on June 30, 2025, operates independently from the Performance report granularity settings. The Insights report maintains its own date range selectors and does not inherit granularity preferences from the Performance report.
Custom annotations, which Google launched on November 17, 2025, attach to specific dates regardless of aggregation level. When viewing weekly or monthly charts, annotations appear on the time period containing the annotated date. Multiple annotations within a single week or month display together on the aggregated period.
The Search Console API continues operating on daily data regardless of interface changes. According to Google's historical patterns, API modifications follow interface updates after extended testing periods. Developers accessing performance data programmatically should expect daily granularity until Google announces API enhancements.
Export functionality accommodates the new granularity options. Users can download performance data at daily, weekly, or monthly aggregation levels directly from Search Console. The exported files maintain consistency with the displayed chart, eliminating manual aggregation requirements for downstream analysis.
Search Console's Performance report serves as the primary interface for organic search traffic analysis. The platform updated performance analysis guidance on December 4, 2024, explaining how to interpret clicks, impressions, click-through rates, and position metrics across different search types.
Marketing professionals rely on Performance report data for content strategy decisions, technical SEO prioritization, and algorithm update impact assessment. Daily data granularity enables rapid response to ranking changes, traffic drops, or indexing issues. Longer-term trend analysis requires different analytical approaches that weekly and monthly views facilitate.
The complexity of Search Console reporting increased significantly throughout 2025. Google integrated AI Mode data into performance totals starting June 17, 2025, preventing website owners from isolating AI Mode performance from traditional search results. This integration made trend analysis more difficult because AI Mode traffic patterns differ from conventional organic search behavior.
Query grouping using AI, which Google introduced on October 27, 2025, addresses search data fragmentation at the query level. That feature consolidates similar search queries into unified clusters, while the new aggregation options address temporal fragmentation. Together, these capabilities provide complementary analysis dimensions.
Subscribe PPC Land newsletter ✉️ for similar stories like this one
The aggregation options matter most for websites experiencing high traffic variability. News publishers see dramatic daily fluctuations based on story timing, publication schedules, and competitive coverage. E-commerce sites experience seasonal patterns and promotional spikes that daily data exaggerates. Service businesses face weekday versus weekend variations that obscure growth trends.
Marketing teams conducting algorithm update analysis benefit from weekly aggregation. Google's core updates typically roll out over multiple days or weeks, creating staggered impacts across different content types. Daily data makes it difficult to determine when impact stabilizes, while weekly trends clarify the overall effect magnitude.
Budget allocation decisions for paid search campaigns often reference organic performance trends. Marketing directors comparing paid and organic channel performance over quarterly periods need consistent time aggregation. Monthly Search Console data aligns better with typical reporting cycles than daily data requiring manual summarization.
Enterprise SEO programs tracking dozens or hundreds of domains face particular challenges with daily data volume. Aggregated views reduce data processing requirements while maintaining trend visibility. Teams monitoring multiple properties can identify portfolio-wide patterns more efficiently using weekly or monthly charts.
The feature arrives during heightened concern about search traffic volatility. Multiple Google algorithm updates throughout 2024 and 2025 created substantial ranking instability across various content types. Website owners struggling to distinguish temporary fluctuations from permanent changes gain analytical tools for pattern isolation.
Weekly aggregation creates approximately 13 data points per quarter, while monthly aggregation produces three data points. The reduction in chart elements improves readability for longer date ranges but sacrifices temporal precision. Users investigating specific incidents require daily data, while strategic planning benefits from aggregated views.
The announcement emphasized using weekly or monthly views for comparison clarity rather than replacing daily analysis. Google maintains daily data as the default setting, requiring users to actively select alternative aggregations. This design choice preserves existing workflows while providing optional enhancements for specific use cases.
Chart vertical axes adjust automatically based on aggregation level. Weekly totals for high-traffic sites reach significantly higher values than daily totals, requiring different scale ranges. The automatic scaling ensures visual comparisons remain proportional across granularity options.
The Performance report supports multiple simultaneous charts comparing different dimensions. Users can display query performance alongside page performance or compare search types within the same view. Each chart maintains independent granularity selection, enabling mixed-aggregation analysis when appropriate.
Content strategy teams evaluating seasonal patterns benefit from monthly aggregation. Comparing December 2024 to December 2025 traffic patterns using monthly views eliminates day-of-week noise and holiday timing variations. The clearer trend lines reveal whether seasonal content performs consistently year-over-year or requires optimization.
SEO migration projects involve substantial technical changes affecting search visibility over extended periods. Website owners migrating platforms, restructuring information architecture, or implementing new technical frameworks track recovery using weekly aggregation. Daily fluctuations during migration periods obscure progress, while weekly trends demonstrate stabilization timing.
Competitive analysis workflows incorporate Search Console data alongside third-party visibility tools. Marketing teams comparing owned property performance against competitor estimates need consistent time periods. Monthly aggregation aligns Search Console data with monthly competitor reports from platforms tracking SERP visibility.
The feature supports board-level reporting requirements where executives expect simplified trend presentations. Monthly aggregation produces concise performance summaries suitable for quarterly business reviews or annual planning sessions. Marketing leaders can present search traffic trends without overwhelming non-technical stakeholders with daily volatility.
The rollout began December 10, 2025, with immediate availability across all geographic regions. Google confirmed the feature deploys to all Search Console properties regardless of site size, traffic volume, or verification method. Domain properties, URL prefix properties, and YouTube channel properties receive access simultaneously.
The company provided no staged rollout timeline or gradual expansion plan. Users accessing Search Console after December 10 can expect the granularity selector to appear in the Performance report chart area. Properties not displaying the feature may require browser cache clearing or account re-authentication.
Google encourages user feedback through multiple channels. Website owners can share comments on LinkedIn or post in the Google Search Central Community. The company historically incorporates user feedback into subsequent feature iterations and documentation updates.
Technical support resources received updates explaining the new functionality. Search Console documentation includes sections describing granularity options, aggregation calculations, and export file structure changes. Help forum moderators received advance notice to address expected user questions.
The modified export structure affects users with automated data pipelines. Marketing analytics teams extracting Search Console data programmatically need to account for changed file formats when weekly or monthly aggregation is active. Column headers shift from date-specific labels to period-specific labels.
File naming conventions now include granularity indicators. Exports from daily views maintain existing naming patterns, while weekly exports append "weekly" indicators and monthly exports include "monthly" designations. Automated systems parsing file names require updates to accommodate the new naming structure.
Sort order modifications ensure exported data aligns with chart display logic. Daily exports sort chronologically by date, weekly exports sort by week start date, and monthly exports sort by month. The consistent sorting across export types maintains data integrity when users compare multiple export files.
Tab names within multi-sheet export files reflect the selected granularity. Users exporting data from multiple Performance report dimensions simultaneously receive separate tabs labeled with dimension names and granularity indicators. This labeling prevents confusion when analyzing exported datasets.
Google's Search Console development patterns suggest continuous feature expansion. The platform introduced social channel performance tracking on December 8, 2025, demonstrating commitment to comprehensive performance visibility across multiple content distribution channels.
The company has not announced plans for additional aggregation options. Quarterly aggregation could serve enterprise reporting needs, though monthly views address most long-term analysis requirements. Custom aggregation period selection would provide maximum flexibility but increases interface complexity.
API integration represents the logical next development step. Third-party SEO tools, agency reporting platforms, and enterprise analytics systems require programmatic access to aggregated data. Google typically extends interface capabilities to API endpoints following stabilization periods.
Machine learning applications could leverage aggregated data for automated insights. Search Console already incorporates AI-powered features for query grouping and content recommendations. Weekly or monthly trend analysis could power predictive forecasting or anomaly detection capabilities.
Subscribe PPC Land newsletter ✉️ for similar stories like this one
Subscribe PPC Land newsletter ✉️ for similar stories like this one
Who: Google Search Central announced the update with Moshe Samet, Product Manager Lead for Search Console, providing official communication. The feature affects website owners, SEO professionals, digital marketers, and content strategists who rely on Search Console for organic search performance analysis.
What: Google introduced weekly and monthly aggregation options for the Search Console Performance report, allowing users to view traffic data at different time granularities beyond the default daily view. The update includes a granularity selector dropdown in the chart area, modified export file structures with updated naming conventions, and consistent metric calculations across aggregation levels. The functionality applies to Search results, Google News, and Discover performance data.
When: The announcement occurred December 10, 2025, with global rollout beginning immediately. The feature deployed to all Search Console properties simultaneously without staged expansion or gradual availability phases.
Where: The granularity selector appears in the Performance report chart area within Google Search Console, accessible globally across all geographic regions. The functionality applies to domain properties, URL prefix properties, and YouTube channel properties verified through Search Console.
Why: Google implemented the feature to address analytical challenges where daily fluctuations obscure long-term performance trends. The update specifically targets date range comparison difficulties where misaligned weekends complicate period-over-period analysis. Weekly and monthly aggregation smooths daily volatility, enabling clearer identification of actual growth or decline patterns. The enhancement supports strategic planning, algorithm update impact assessment, and board-level reporting requirements where simplified trend presentations benefit stakeholders without technical SEO expertise.