Google unlocks cross-data filtering and visibility controls in Looker Studio
Google introduces cross-data source filtering, component visibility controls, and histogram charts to Looker Studio on January 15, expanding reporting capabilities.

Google introduces cross-data source filtering, component visibility controls, and histogram charts to Looker Studio on January 15, expanding reporting capabilities.
Google today released three significant enhancements to Looker Studio, introducing cross-data source filtering capabilities, granular component visibility controls, and histogram chart functionality that expands the platform's analytical and presentation capabilities for digital marketing professionals.
The January 15, 2026 updates address longstanding technical limitations in multi-source reporting workflows while introducing statistical visualization tools previously unavailable in the platform. According to the release documentation, these features enable report creators to build more sophisticated dashboards that consolidate data from disparate sources while maintaining precise control over information access.
The cross-data source filtering feature resolves a fundamental technical constraint that has prevented controls from effectively filtering charts based on different data sources. Report creators can now override default field IDs at the report level, enabling a single filter control to operate across charts that draw from Google Sheets, BigQuery, Google Ads, or any combination of data sources within the platform's connector ecosystem.
The implementation works by allowing editors to assign identical field IDs to dimensions from different sources through the Resource > Manage field names and IDs interface. When applied, this override ensures that filter controls recognize semantically equivalent fields across data sources despite variations in underlying schema implementations. The documentation specifies that editors must manually select matching fields and assign new IDs through the Add field override function.
Technical constraints accompany the new capability. Field ID changes apply exclusively at the report level rather than chart or data source contexts. Modifying a field ID already in use within a report breaks existing charts that reference that identifier, requiring manual field reselection to restore functionality. The documentation emphasizes that fields assigned matching IDs must share identical data types to prevent query errors.
The feature addresses a measurement challenge familiar to marketing organizations operating cross-platform campaigns. Different advertising and analytics systems generate dimension names and identifiers based on internal conventions. A "campaign name" dimension in Google Ads may carry a different field ID than an equivalent dimension in Facebook Ads data, preventing filter controls from affecting both visualization types simultaneously despite conceptual equivalence.
Marketing teams managing unified dashboards that combine Google Ads performance data with Facebook Ads metrics, Google Analytics behavior data, and CRM information from Salesforce or HubSpot can now implement single controls that filter entire reports. Previously, such scenarios required duplicate filter controls for each data source or complex workarounds using blended data sources that introduced query performance implications.
The cross-data source filtering capability builds upon recent Looker Studio enhancements that expanded parameter functionality and modernized chart interfaces throughout November 2025. Parameter-enabled filter defaults introduced November 13, 2025 allow dynamic filter configuration, creating synergies with the new field ID override system for advanced dashboard automation scenarios.
Looker Studio now supports hiding individual charts and components for all viewers or for specified viewer subsets through a new Control visibility feature. The functionality introduces access management capabilities that enable report creators to display sensitive business metrics exclusively to authorized personnel while maintaining unified report structures.
Implementation operates through group membership variables that specify Google Groups and email addresses authorized to view particular components. Pro users can create new group membership variables during visibility configuration or manage them through the Resource > Manage variables interface. The system evaluates viewer credentials against specified groups when rendering reports, displaying or hiding components based on membership status.
Report editors access the feature by hovering over specific charts or components, selecting the three-dot menu icon, and choosing Control Visibility. The interface presents existing group membership variables or enables creation of new variables containing authorized email addresses. The system applies visibility rules at the component level, allowing granular control over dashboard elements without requiring separate report versions.
The capability addresses information security requirements in enterprise reporting environments. Financial performance dashboards may contain revenue metrics, profit margins, or strategic planning data that should remain visible to executive teams while other sections display campaign performance available to broader marketing organizations. Previous implementations required maintaining multiple report versions or restricting entire dashboard access.
According to the documentation, only Looker Studio Pro users can create new group membership variables, though the visibility control functionality itself operates on components within any report type. This access restriction means organizations without Pro subscriptions must rely on existing variables or request Pro-enabled colleagues to configure new visibility groups.
The security model differs from page-level visibility controls introduced in earlier releases. While page visibility prevents access to entire report sections, component-level controls enable sophisticated layouts where sensitive and public information coexist on single pages. A performance dashboard page might display overall campaign metrics to all viewers while restricting detailed cost breakdowns to finance-approved personnel.
Integration with Google's identity infrastructure enables centralized access management. Organizations managing Google Groups for email distribution, document sharing, and application access can leverage existing group definitions for report component visibility without maintaining separate permission systems. Changes to group membership automatically propagate to Looker Studio visibility rules.
Marketing organizations operating across regions or business units can implement reporting frameworks where universal metrics remain visible while market-specific performance data or competitive intelligence restricts to relevant teams. The system supports multiple visibility conditions on different components within single reports, enabling complex access hierarchies.
The histogram chart implementation brings statistical distribution visualization to Looker Studio's chart library. Histograms group numeric data into bins of specified widths, displaying frequency distributions that reveal data shape, center, and spread characteristics. According to the documentation, these visualizations expose patterns that remain hidden in alternative chart types like pie charts or standard bar charts.
Looker Studio's histogram implementation accepts a single bin dimension, optionally broken down by a secondary dimension. Users configure bin count and size directly within chart properties, with Looker Studio supporting both automatic bin generation and manual bin field creation. The platform automatically selects Record count as the default metric when available, though editors can specify alternative metrics for data sources lacking Record count fields.
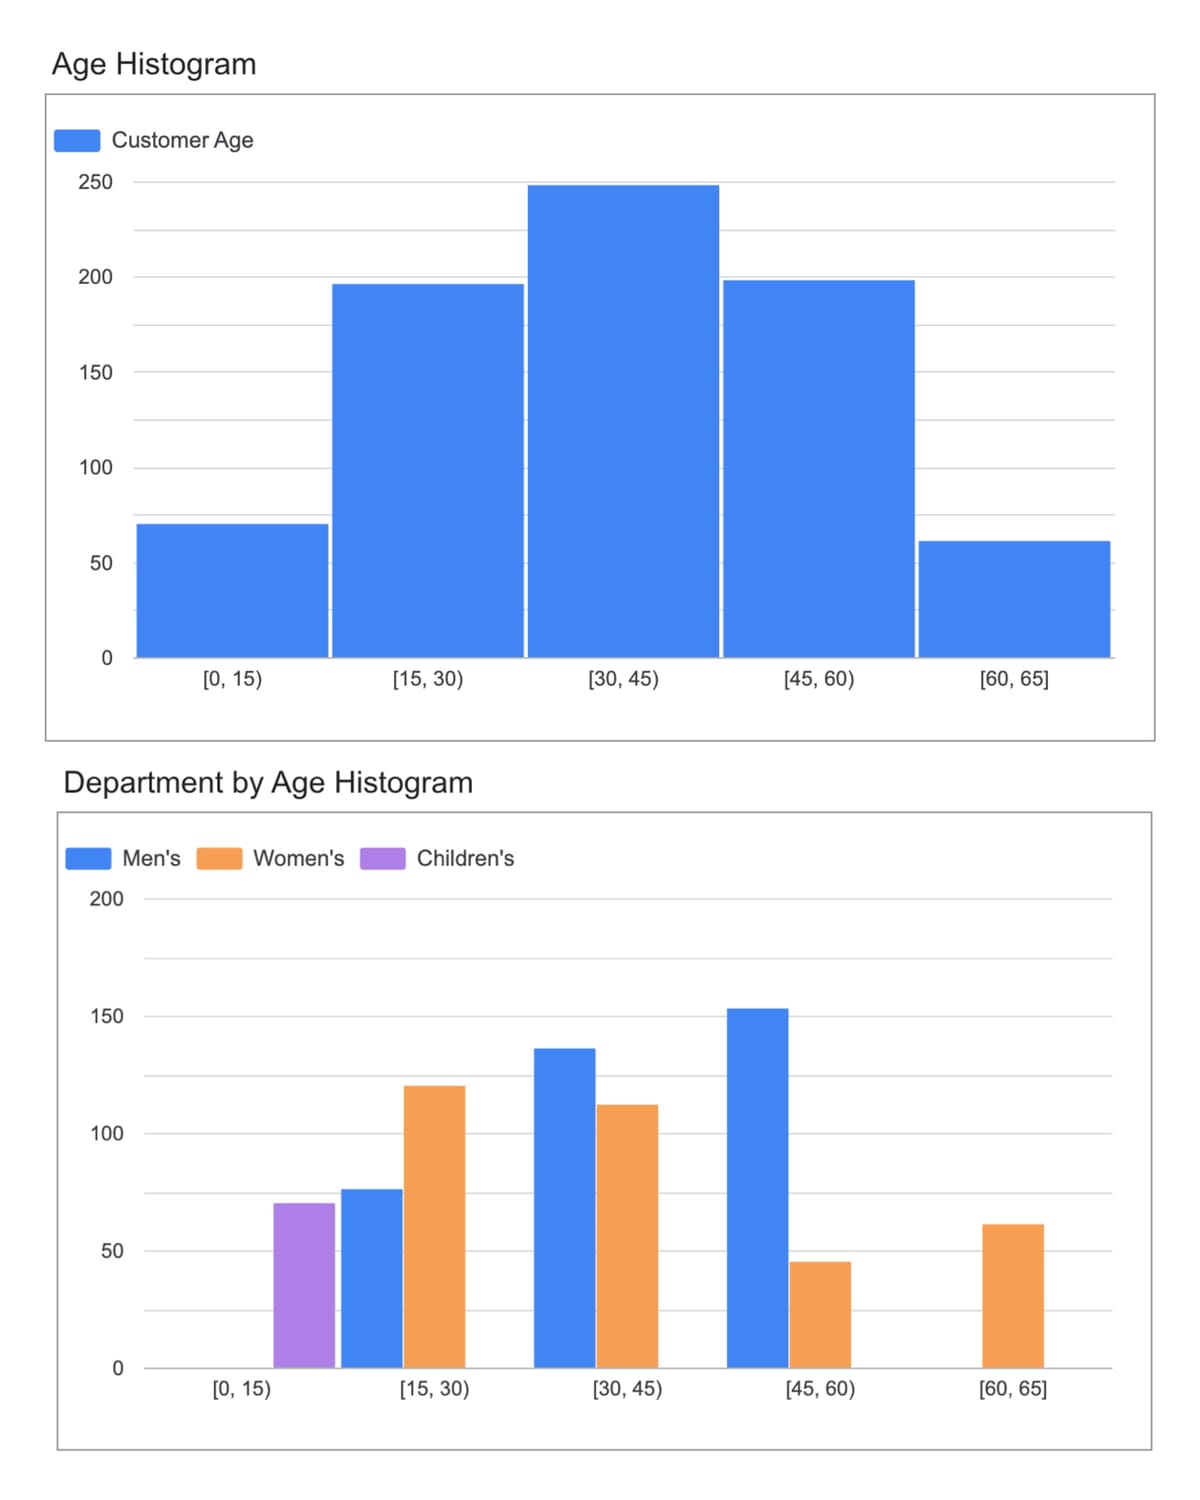
The histogram reference documentation provides a customer demographics use case demonstrating the chart type's analytical capabilities. Analyzing customer age distributions across purchase records enables marketing teams to identify concentration patterns that inform targeting strategies. A histogram displaying customer age ranges on the X-axis and customer counts on the Y-axis reveals whether the customer base skews toward teenagers, young adults, or older demographics.
Breakdown dimensions enable comparative analysis across categorical variables. Adding a clothing department breakdown to age distribution histograms shows how different product lines appeal to specific age groups. This multi-dimensional analysis capability supports merchandising decisions and advertising allocation across demographic segments.
The documentation emphasizes histogram advantages over traditional chart types for continuous numeric data. Pie charts and bar charts require predefined categories, introducing arbitrary groupings that may obscure actual data distributions. Histograms automatically generate bins matching data characteristics, providing precision that reveals subtle patterns like customer concentration at specific ages rather than broad age ranges.
Adjacent bars in histogram visualizations represent data continuity accurately, showing progression from one numeric range to the next. This contrasts with pie and bar charts that treat each segment as discrete, independent categories regardless of underlying data relationships. The visual continuity proves essential when analyzing metrics like customer age, transaction values, page load times, or conversion rates.
Outlier detection represents another histogram strength highlighted in the documentation. Visualizing complete frequency distributions exposes unusual data concentrations that aggregated metrics or simplified chart types might obscure. A small but notable customer segment above age 60 might represent expansion opportunity that remains invisible in pie chart slices representing "adults 40+."
Technical implementation includes customization options for bin configuration, axis settings, color schemes, and reference lines. The Setup tab controls data source selection, dimension specification, metric configuration, filtering, and sorting behavior. Style tab options encompass chart titles, histogram orientation, data labels, color mapping, axes display, grid appearance, and legend positioning.
The histogram documentation specifies current limitations affecting functionality. Charts using Record count as the metric cannot switch to alternative metrics. Histograms lack support for optional metrics, drill-down functionality, and "Others" bin aggregation for outlier values. The chart type cannot visualize blended data sources, restricting usage to single-source scenarios.
Looker Studio's chart library expansion throughout 2025 introduced waterfall charts for sequential value analysis, boxplot charts for distribution visualization, and candlestick charts for range representation. The histogram addition continues the platform's movement toward statistical analysis capabilities that extend beyond traditional business intelligence charting.
The three features collectively address different aspects of enterprise reporting requirements. Cross-data source filtering eliminates technical barriers preventing unified dashboard controls across marketing technology stacks. Organizations consolidating Google Ads campaigns, social media advertising, email marketing performance, and website analytics can now implement single date range pickers, campaign name filters, or geographic controls that affect all visualizations simultaneously.
Component visibility controls support organizational hierarchies and information security policies that previously required complex workarounds or separate report distributions. Marketing teams can build comprehensive performance dashboards where all stakeholders access relevant metrics while sensitive information like profit margins, competitive bid strategies, or unreleased campaign details remain restricted to authorized personnel.
Histogram charts enable data quality analysis and audience research that standard visualization types cannot adequately support. Marketing organizations analyzing customer lifetime value distributions, purchase frequency patterns, session duration characteristics, or conversion latency can identify data anomalies, audience segmentation opportunities, and performance outliers that inform strategic decisions.
The timing of these releases follows Looker Studio's December 23, 2025 partner connector expansion that added retail media network integrations and the December 11 introduction of Slack report delivery for Pro subscribers. The platform's development trajectory emphasizes both data integration breadth through connector additions and analytical depth through enhanced visualization and control capabilities.
Cross-data source filtering interacts with parameter functionality introduced November 13, 2025. Parameters serving as filter defaults can now affect charts from multiple data sources through field ID overrides, enabling sophisticated dashboard automation. A parameter-driven date range control can simultaneously filter Google Ads performance, Google Analytics behavior data, and Salesforce opportunity data when editors configure matching field IDs.
Component visibility aligns with Looker Studio's broader enterprise features including team workspace folders, scheduled delivery controls, and Cloud Audit Logs for Pro subscriptions. Organizations implementing data governance policies around performance reporting can leverage visibility controls as part of comprehensive access management frameworks that restrict information based on role, region, or organizational unit.
Histogram charts complement recent analytical enhancements like the Code Interpreter preview that enables Python-based statistical analysis. Marketing analysts examining customer behavior patterns can use histograms to visualize distributions of engagement metrics, transaction values, or conversion paths before applying advanced statistical techniques through Code Interpreter functionality.
Implementation considerations vary across the three features. Cross-data source filtering requires careful field ID management to avoid breaking existing chart configurations. Organizations should document field override decisions and test controls thoroughly across all affected charts before deploying reports to broader audiences. The irreversible nature of field ID changes means production implementations should follow rigorous testing protocols.
Component visibility configuration demands clear access policies defining which personnel should view specific information types. Marketing organizations should establish visibility standards before implementing controls at scale, potentially aligning component access with existing Google Groups structures used for document sharing and email distribution. Maintaining separate group definitions for Looker Studio visibility risks creating permission inconsistencies.
Histogram chart adoption requires understanding appropriate use cases and limitations. Marketing teams analyzing continuous numeric data like customer age, transaction values, or session duration will find histograms valuable. Categorical data or metrics requiring complex comparative analysis may demand alternative chart types. The inability to blend data sources restricts histogram usage to single-source scenarios.
Professional services and consulting organizations building Looker Studio implementations for clients can leverage cross-data source filtering to deliver unified dashboards without complex data modeling requirements. The field ID override capability eliminates scenarios where matching dimension names across sources proved insufficient for control functionality, reducing implementation complexity.
Advertising agencies managing multi-platform campaign reporting can implement component visibility to display comprehensive performance data to clients while restricting markup percentages, internal notes, or competitive analysis to agency personnel. This controlled information sharing supports transparency requirements without exposing sensitive business operations.
Data analytics teams supporting marketing organizations can deploy histogram charts for exploratory data analysis and data quality validation. Visualizing distributions of key metrics exposes data anomalies, outliers, or unexpected patterns that require investigation. Histograms serve as diagnostic tools before implementing more sophisticated analyses or building production dashboards.
All three features launched with general availability on January 15, 2026, according to the release documentation. Cross-data source filtering and histogram charts operate across free Looker Studio accounts and Pro subscriptions. Component visibility configuration through new group membership variable creation requires Looker Studio Pro access, though visibility controls themselves function on any report type.
The cross-data source filtering documentation specifies field ID overrides apply at the report level only. Changes affect all charts using modified field IDs throughout the report, preventing isolated overrides for individual visualizations. Editors modifying field IDs already in use must manually repair broken charts by reselecting appropriate fields from data sources.
Component visibility operates through group membership variables containing Google Groups or individual email addresses. The system evaluates viewer credentials when rendering reports, displaying or hiding components based on group membership. Visibility rules persist across viewing sessions and apply consistently regardless of access method, whether through direct links, embedded reports, or scheduled deliveries.
Histogram charts support data sources providing Record count metrics or allowing metric selection. The chart type accepts single bin dimensions with optional breakdown dimensions, supporting up to automatic or manually specified bin counts. Visualization customization includes orientation selection, data label configuration, color mapping, axes control, and grid styling through Setup and Style tab properties.
Related resources include documentation on working with data sources, adding filter controls to reports, and understanding field properties. The Histogram reference page provides detailed information on chart configuration, styling options, and limitations affecting blended data sources, optional metrics, and drill-down functionality.
Organizations implementing these features should review the complete documentation for field ID override procedures, group membership variable management, and histogram chart configuration requirements. Testing protocols should validate cross-data source filter behavior across all affected charts, component visibility rules against intended access policies, and histogram displays for appropriate data distributions.
Who: Google released three enhancements to Looker Studio affecting marketing professionals, data analysts, and business intelligence teams building cross-platform performance dashboards and statistical visualizations.
What: Cross-data source filtering enables controls to affect charts from different data sources through field ID overrides. Component visibility controls allow hiding individual charts for specified viewer groups. Histogram charts visualize numeric data distributions showing frequency patterns across automatically or manually configured bins.
When: January 15, 2026, with immediate availability across free Looker Studio accounts and Pro subscriptions, though group membership variable creation for visibility controls requires Pro access.
Where: Features deploy globally within Looker Studio's web-based interface through report editing tools, accessible via Resource > Manage field names and IDs for filtering, component three-dot menus for visibility, and standard chart creation workflows for histograms.
Why: The enhancements address technical limitations preventing unified filtering across multi-source dashboards, information security requirements demanding selective component access, and statistical analysis needs for distribution visualization beyond traditional chart capabilities.