Harvey Norman tops New Zealand's ad spenders as telcos surge 25%
Harvey Norman leads New Zealand's 2025 ad spend rankings, overtaking Foodstuffs NZ, as telecoms jump 25% and beverages rise $40.5m, per Nielsen Ad Intel data.

Harvey Norman leads New Zealand's 2025 ad spend rankings, overtaking Foodstuffs NZ, as telecoms jump 25% and beverages rise $40.5m, per Nielsen Ad Intel data.
Harvey Norman today claimed the top spot in New Zealand's advertising expenditure rankings for 2025, displacing Foodstuffs NZ as the country's highest-spending brand. The finding comes from Nielsen's annual New Zealand's Biggest Ad Spenders of 2025 report, released on March 3, 2026, and powered by Nielsen Ad Intel, the company's cross-platform competitive intelligence platform.
The report tracks gross advertising investment across major media at published rate card values and covers the full January-to-December 2025 period. Its publication offers one of the clearest annual snapshots of where New Zealand's largest organisations chose to commit their media budgets, and where competitive pressure intensified most sharply across categories.
Retail remained the undisputed heavyweight of New Zealand advertising in 2025, commanding $675.4 million in measured investment - comfortably ahead of every other category. Leisure and entertainment ranked second at $465.4 million, followed closely by foodstuffs at $441.8 million. Government departments, services and community rounded out the top four with $379.2 million, while automotive came fifth at $346.3 million.
The numbers matter to marketers tracking competitive dynamics because they signal not just who spends the most, but which sectors are accelerating. The biggest year-on-year dollar increases from 2024 to 2025 were concentrated in two categories: telecommunications added $41.8 million, a 25% rise, and beverages added $40.5 million, also a 25% increase. Government and community services climbed $24.8 million (up 7%), travel increased $23.8 million (up 10%), and business services added $21.6 million (also up 10%).
That two unrelated categories - telecoms and beverages - both recorded identical 25% growth rates points to how differently competitive pressure can manifest across a market. Telcos are fighting for subscribers in a three-way contest, while beverage brands appear to have concluded that paid media is essential to defending shelf share in a cost-conscious consumer environment.
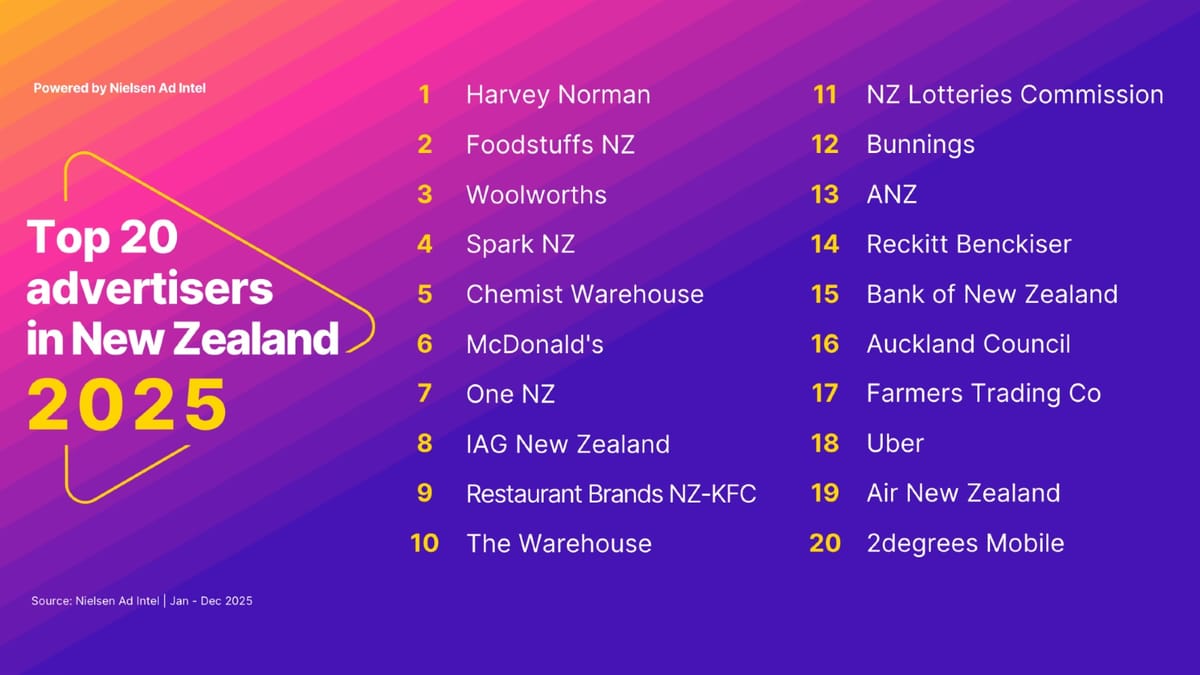
The full ranked list of New Zealand's top 20 advertisers for 2025, according to Nielsen Ad Intel, runs as follows: 1. Harvey Norman, 2. Foodstuffs NZ, 3. Woolworths, 4. Spark NZ, 5. Chemist Warehouse, 6. McDonald's, 7. One NZ, 8. IAG, 9. KFC, 10. The Warehouse, 11. NZ Lotteries Commission, 12. Bunnings, 13. ANZ, 14. Reckitt Benckiser, 15. Bank of New Zealand, 16. Auckland Council, 17. Farmers Trading Co, 18. Uber, 19. Air New Zealand, 20. 2degrees Mobile.
Several movements within that list are notable. Spark NZ climbed from eighth to fourth position, which reflects the scale of investment the country's largest telecommunications company committed to defending and growing its base. One NZ held at seventh. 2degrees Mobile, the third major telco, entered the Top 20 for the first time at number 20. Taken together, three of the country's top telcos now sit inside the twenty-brand ranking - a concentration that directly mirrors the 25% category growth figure.
In quick-service restaurants, McDonald's climbed from tenth to sixth, a four-place jump that underlines sustained and rising investment from the world's most recognised fast food chain. KFC moved in the opposite direction, slipping from fifth to ninth, though it retained a Top 10 position. Both brands represent the kind of high-frequency purchase categories where advertising pressure rarely relents.
Retail competition also sharpened below the top of the table. The Warehouse moved from twelfth to tenth, and Bunnings lifted from sixteenth to twelfth - both chains investing more aggressively in a period of economic uncertainty when consumers are weighing discretionary spending decisions carefully. Chemist Warehouse remained in the Top 5, dipping marginally from fourth to fifth.
New entrants reshaped the composition of the list. Auckland Council debuted at number 16, Air New Zealand at 19, and 2degrees Mobile at 20. Three brands that featured in 2024 - Unilever Australasia, Brand Developers and Mitre 10 - dropped out entirely. Among the banks, Bank of New Zealand strengthened its position, climbing from twentieth to fifteenth, while ANZ dropped from sixth to thirteenth, suggesting a reallocation of media investment between the country's major financial institutions rather than a wholesale withdrawal from the market.
Beyond individual brand movements, the category-level investment data maps how New Zealand's entire advertising market is structured. The top 20 ad spend categories by investment in 2025 were: retail ($675.4m), leisure and entertainment ($465.4m), foodstuffs ($441.8m), government departments, services and community ($379.2m), automotive ($346.3m), investment, finance and banking ($303.6m), travel ($264.4m), home improvements($263.5m), pharmaceuticals and health ($251.6m), business services ($246.0m), real estate ($244.5m), telecommunications ($206.8m), beverages ($200.6m), insurance ($179.0m), computers ($171.0m), household furnishings ($137.1m), household electrical products ($89.0m), toiletries and cosmetics ($82.0m), clothing ($72.8m), and household cleaning products ($46.3m).
The gap between retail ($675.4m) and the twentieth-ranked category, household cleaning products ($46.3m), is striking. Retail outspends its nearest rival, leisure and entertainment, by more than $200 million. This reflects not only the scale of New Zealand's retail sector but the extent to which supermarkets, pharmacy chains, hardware stores and electronics retailers rely on persistent mass-media presence to drive store traffic and protect category share.
The presence of home improvements at eighth ($263.5m) and household furnishings at sixteenth ($137.1m) - both substantial sums - reflects how significantly Harvey Norman and Bunnings contribute to those categories, since both operate at the intersection of electrical goods, furniture and home improvement. The combined weight of these two retailers within those categories helps explain why Harvey Norman was able to climb to the top of the overall advertiser rankings.
According to Rose Lopreiato, Nielsen Ad Intel's Pacific Commercial Lead, the report captures more than raw volume. "In New Zealand, it's not only about how much you spend, but where you place it. With retail still leading the market and competition heating up in categories where consumers are comparing value and changing providers, marketers need a sharper view of where the pressure is building, both the sectors drawing the biggest budgets and the brands increasing their share of voice."
Lopreiato has previously led commentary on New Zealand market analysis for Nielsen, including the company's 2024 automotive advertising report, which tracked a $124 million year for the passenger vehicle category. That report showed Nissan more than doubled its investment in 2024, advancing from ninth to third in the automotive rankings - a pattern that underlines how swiftly individual brands can reposition when they increase media commitment.
Nielsen monitors gross advertising expenditure in major media at published rate card values. The company notes that while discounts are available from some media owners, rates are not openly disclosed, which means figures represent rate card investment rather than actual cash outlay. Category and brand groupings are compiled at Nielsen's discretion. The data covers January to December 2025 and draws on Nielsen Ad Intel, which the company describes as offering cross-platform review-and-compare capabilities across media, company, category and brand, with access to historical data.
Nielsen launched Advanced Audiences in Australia and New Zealand in September 2024, expanding its targeting tools for the Pacific region beyond traditional audience measurement. It secured a two-year television measurement extension in New Zealand as part of broader efforts to maintain measurement standards across the country's fragmented media environment. The company has also expanded Ad Intel to Australia with Connected TV intelligence during Q4 2025, a development that directly affects how advertisers in both markets will track competitive spending on streaming platforms going forward.
These expansions matter for reading the 2025 New Zealand report in context. As more advertising migrates to streaming and digital environments, the rate card figures captured by Ad Intel may increasingly reflect only a portion of total competitive investment, particularly in categories where programmatic and digital-first buying dominates.
The report's release is significant for the marketing and advertising community for several reasons. First, the rapid growth of telecommunications advertising - three operators now inside the Top 20 - signals that the New Zealand telco market is entering a more intensive phase of competition, likely linked to ongoing 5G rollout, bundled services, and the continuing fight for mobile and broadband subscribers. Any brand operating in adjacent categories, or any media owner trying to forecast revenue, will want to understand where that pressure is concentrated.
Second, the beverages category's 25% expansion, reaching $200.6 million, puts it at thirteenth in the overall category rankings. Given that beverages encompasses soft drinks, alcoholic drinks, energy drinks, and increasingly non-alcoholic alternatives, the category's growth likely reflects both competitive intensity among established players and new entrant investment as brands attempt to establish presence in emerging segments.
Third, the bank movements - BNZ rising, ANZ falling within the rankings - suggest that financial services advertising is being reallocated rather than reduced. Investment, finance and banking sits sixth overall at $303.6 million, with insurance adding $179 million on top of that. Together, financial sector advertising totals approximately $482.6 million, which exceeds even the leisure and entertainment category. The strategic implications for media planners buying for financial clients, or competing against them, are considerable.
Finally, the entry of Auckland Council at sixteenth, spending enough to rank inside New Zealand's top twenty advertisers, points to a public sector that is maintaining significant media investment. Government departments, services and community sit fourth overall at $379.2 million, a $24.8 million increase year-on-year. That category's 7% growth suggests ongoing public sector campaigns around health, community services, and civic information.
Despite what the report describes as "ongoing economic pressures," the breadth of investment across categories demonstrates that brands prioritised advertising to protect share and maintain consumer awareness - particularly in sectors where purchasing decisions are more deliberate. Categories like telecommunications, travel and automotive are defined by consumers actively comparing options. In those environments, advertising investment translates directly into consideration, and pulling back means ceding ground.
Who: Nielsen, via its Ad Intel platform, measuring advertising investment across New Zealand's major media. Key figures include Rose Lopreiato, Nielsen Ad Intel's Pacific Commercial Lead. The report covers New Zealand's top 20 advertisers led by Harvey Norman, Foodstuffs NZ and Woolworths, with Spark NZ, One NZ and 2degrees Mobile representing telecommunications, and McDonald's, KFC, The Warehouse, Bunnings and Chemist Warehouse representing retail and quick-service restaurants.
What: The annual New Zealand's Biggest Ad Spenders of 2025 report, powered by Nielsen Ad Intel, revealing the country's largest advertisers and advertising categories by gross investment at published rate card values for the full year 2025. Harvey Norman displaced Foodstuffs NZ as the top-spending brand. Telecommunications and beverages each recorded 25% year-on-year growth. Retail led all categories at $675.4 million. The top 20 advertiser list saw three new entrants - Auckland Council, Air New Zealand and 2degrees Mobile - while Unilever Australasia, Brand Developers and Mitre 10 dropped out.
When: The report was released on March 3, 2026, covering advertising expenditure data for January to December 2025, with year-on-year comparisons drawn against the full-year 2024 period.
Where: New Zealand, across major media monitored by Nielsen Ad Intel at published rate card values. The report was released from Auckland and is applicable to New Zealand's national advertising market, covering all major media channels.
Why: The report provides advertisers, agencies and media owners with an independent, comprehensive view of competitive advertising investment across New Zealand. In a market where retail, telecommunications and financial services categories are experiencing intensified competition, knowing where rivals are committing media budget - and at what scale - is central to media planning, share of voice strategy and investment decisions. The 2025 data is particularly relevant because telecommunications and beverages growth of 25% each signals that competitive dynamics in those categories are accelerating, with direct implications for brands in adjacent markets and for media owners across the country.