NFL drives broadcast television to highest share in nearly a year
Streaming platforms Amazon Prime Video, Peacock, and Paramount+ see viewership gains on football game days, according to Nielsen's October data.

Streaming platforms Amazon Prime Video, Peacock, and Paramount+ see viewership gains on football game days, according to Nielsen's October data.
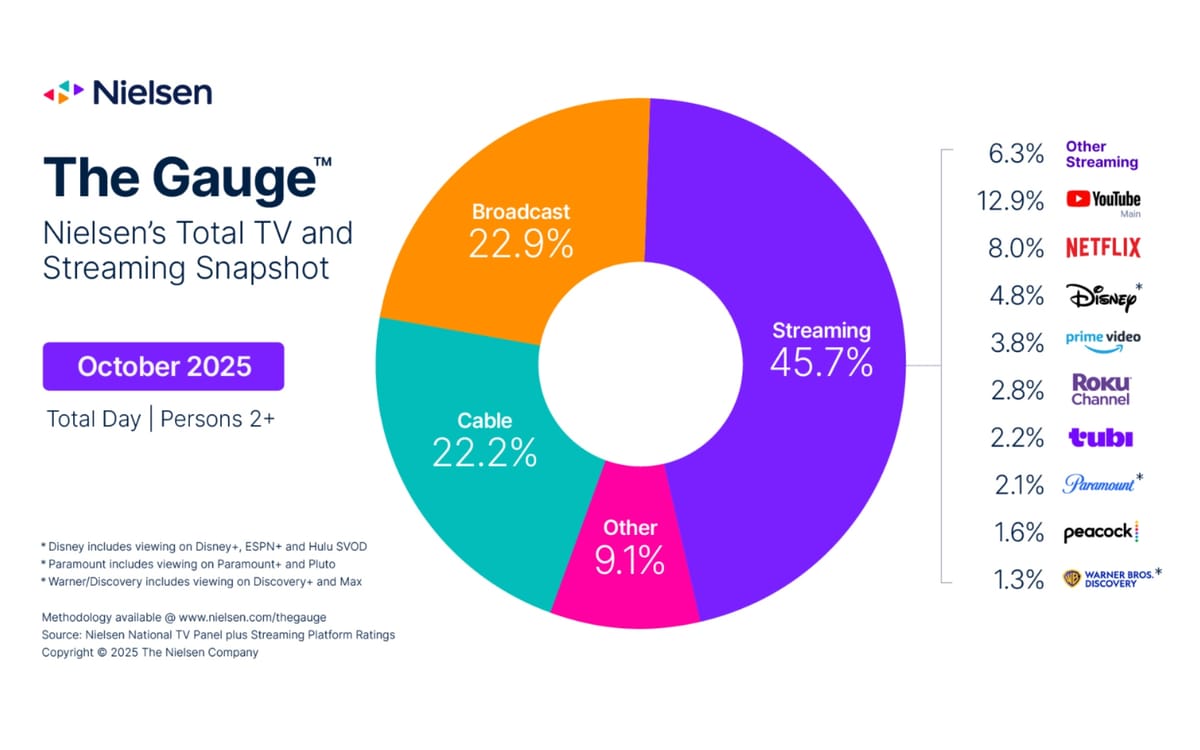
Broadcast television claimed 22.9% of total viewing time in October 2025, the category's strongest performance since November 2024, driven primarily by NFL coverage across CBS, FOX, and NBC networks. The month-over-month increase of 4.3% positioned broadcast ahead of cable television, which held 22.2% share, while streaming maintained dominance at 45.7% of total watch-time, according to Nielsen's The Gauge report released November 18, 2025.
The NFL's impact extended beyond traditional broadcast channels. Streaming services hosting football games demonstrated substantial viewership increases on game days compared to their weekly averages. Peacock averaged 1.6% of total television time throughout October but climbed to 2.0% share on Sundays, representing a 19% month-over-month increase. Paramount+ reached 1.6% share on Sundays despite averaging 1.2% during weekdays, marking an 8% viewing gain versus September. Amazon Prime Video, which broadcasts Thursday Night Football, captured 6.4% of television viewing on Thursdays—a three-point jump from its monthly average.
Sunday programming showed the most dramatic viewing pattern shifts across all television categories during October. Broadcast viewership averaged 22.0% of TV from Monday through Saturday but surged to 27.3% on Sundays, a 5.3-point gain. Cable and streaming experienced inverse effects, with both categories recording higher watch-time during weekdays and noticeably lower shares on Sundays when NFL games dominate screens.
The October 2025 measurement interval spanned four weeks from September 29 through October 26, following Nielsen's broadcast calendar methodology where weekly intervals begin on Monday.
Sports programming accounted for nearly a third of all broadcast viewing in October despite a 6.4% decline compared to September. NFL games on CBS, FOX, and NBC captured the top three program rankings with over 20 million viewers each based on Live+7 data. Broadcast television achieved 24% share in October 2024, marking its highest viewership level at that time since January 2024.
The fall television season contributed significantly to broadcast gains beyond sports content. Broadcast drama viewership increased 28% over September, with Tracker, Matlock, and NCIS on CBS leading category performance alongside High Potential on ABC and Chicago Fire on NBC. This represented the largest monthly gain within the broadcast drama category.
Streaming viewership increased 2.4% month-over-month, outpacing overall TV usage growth of 1.3% to gain half a share point. The surge was primarily fueled by football viewing across key streaming platforms. Netflix maintained 8.0% of total TV in October while demonstrating unusual resilience on Sundays—traditionally dominated by NFL programming—where its share increased to 8.2% of television viewing. The platform's original series Monster: The Ed Gein Story became October's most-streamed title with 5.4 billion minutes viewed.
Roku-powered devices captured 21.4% of total television viewing time compared to broadcast's 18.4% share in July 2025, representing broader industry trends toward on-demand content consumption before the fall sports season began.
Cable watch-time in October tracked closely with overall usage at 1.2% growth, but the category's share of TV slipped 0.1 points due to rounding. Cable sports viewership increased nearly 50% versus September and represented 14% of the category's viewing total. Feature films exhibited a 7% monthly increase as viewers sought Halloween-themed content throughout October. Cable news continued leading cable viewing and owned nearly a quarter of the category's share despite a 3% drop from September.
The advertising implications of these viewing patterns demonstrate how premium sports content drives cross-platform engagement strategies. Disney expanded streaming advertising reach through NFL partnership announced in August 2025, including ESPN's acquisition of NFL Network assets that provides the league with a 10% equity stake in ESPN. The transaction creates substantial inventory opportunities for advertisers seeking premium content environments across both broadcast and streaming platforms.
Thursday Night Football's presence on Amazon Prime Video exemplifies streaming's growing role in premium sports distribution. YouTube streamed its first free NFL game globally in September 2025 when it exclusively broadcast the Kansas City Chiefs versus Los Angeles Chargers game from São Paulo, Brazil, marking a milestone in streaming sports advertising territory.
The NFL's multiplatform distribution strategy creates measurement complexities for advertising professionals. Campaign Manager 360 added Netflix ads integration and TV measurement tools in February 2025, introducing cross-media reach reporting that enables advertisers to measure streaming campaigns alongside linear TV inventory using third-party data from Comscore.
Programmatic advertising infrastructure continues adapting to streaming sports inventory. TCL and PubMatic partnered to enhance live sports advertising in January 2025, connecting TCL's premium programmatic streaming inventory including NFL Channel and CBS Sports with PubMatic's integrated platform to drive demand efficiency.
The shift toward streaming sports consumption affects adjacent betting and fantasy platforms differently. NFL betting apps faced install decline as fantasy platforms surged according to AppsFlyer and Sensor Tower data released November 12, 2025. Sports betting apps recorded 39% fewer installs during the 2025 NFL season's first 14 weeks, while fantasy platforms achieved 40% user growth and 106% revenue gains.
Buy ads on PPC Land. PPC Land has standard and native ad formats via major DSPs and ad platforms like Google Ads. Via an auction CPM, you can reach industry professionals.
Nielsen's measurement methodology combines data from its 42,000-home panel with inputs from 45 million households and 75 million devices including cable set-top boxes, satellite receivers, and smart TVs. Nielsen launched Big Data + Panel measurement for the 2025 TV season, marking the first time the company received Media Rating Council accreditation for a national TV measurement system combining traditional panel data with large-scale device information.
The convergence of broadcast and streaming distribution for premium sports content reflects broader industry transformation. ESPN acquired NFL Network assets in a landmark 10% equity exchange deal announced August 5, 2025, positioning the direct-to-consumer service to launch August 21 with enhanced app features including multiview, personalized sports centers, and integration of stats, betting, and fantasy sports.
October's viewing patterns demonstrate that the NFL functions as a multiplatform catalyst capable of driving simultaneous gains across broadcast networks and streaming services. The league's ability to maintain substantial audiences on traditional television while propelling growth for digital platforms distinguishes it from other content categories experiencing zero-sum competition between distribution channels.
Streaming's 45.7% share of television time in October represents the category's continued dominance even during periods when broadcast sports programming typically claims larger audiences. The data suggests premium live sports content attracts viewers to specific platforms rather than fundamentally altering underlying consumption patterns that favor on-demand streaming services.
The measurement interval's timing captured the heart of the NFL regular season when games air across multiple days and platforms each week. Broadcast's 22.9% share matched cable's 22.2% share within rounding margins, demonstrating how premium sports programming temporarily narrows the gap between traditional television categories that otherwise show cable maintaining consistent advantages during non-sports periods.
Subscribe PPC Land newsletter ✉️ for similar stories like this one
Subscribe PPC Land newsletter ✉️ for similar stories like this one
Who: Nielsen measured television viewing across broadcast networks (CBS, FOX, NBC), cable channels, and streaming platforms including Peacock, Paramount+, Amazon Prime Video, and Netflix. The data encompasses viewing from Nielsen's 42,000-home panel representing more than 100,000 people nationwide.
What: Broadcast television achieved 22.9% share of total viewing time in October 2025, marking its highest performance since November 2024 with a 4.3% month-over-month increase. Streaming maintained 45.7% share while cable held 22.2%. NFL programming drove simultaneous gains across broadcast networks and streaming services hosting games, with Sunday viewership showing the most dramatic category shifts.
When: The October 2025 measurement interval spanned four weeks from September 29 through October 26, 2025. Nielsen released The Gauge report on November 18, 2025. The measurement captured the heart of the NFL regular season when games air across multiple days and platforms each week.
Where: The viewing data covers United States television consumption measured through Nielsen's panel of 42,000 homes combined with inputs from 45 million households and 75 million devices including cable set-top boxes, satellite receivers, and smart TVs. The measurement encompasses viewing through television screens, excluding mobile device consumption.
Why: The NFL's multiplatform distribution strategy created simultaneous viewing increases across traditional broadcast networks and streaming services, distinguishing it as a rare content category capable of driving growth across competing distribution channels. Premium live sports programming attracts viewers to specific platforms rather than fundamentally altering underlying consumption patterns favoring on-demand streaming. The data matters for advertising professionals as it demonstrates how premium sports content creates inventory opportunities across both traditional and digital platforms, requiring cross-platform measurement capabilities and integrated campaign strategies.