Shopify analytics complexity increases as merchant data gaps emerge
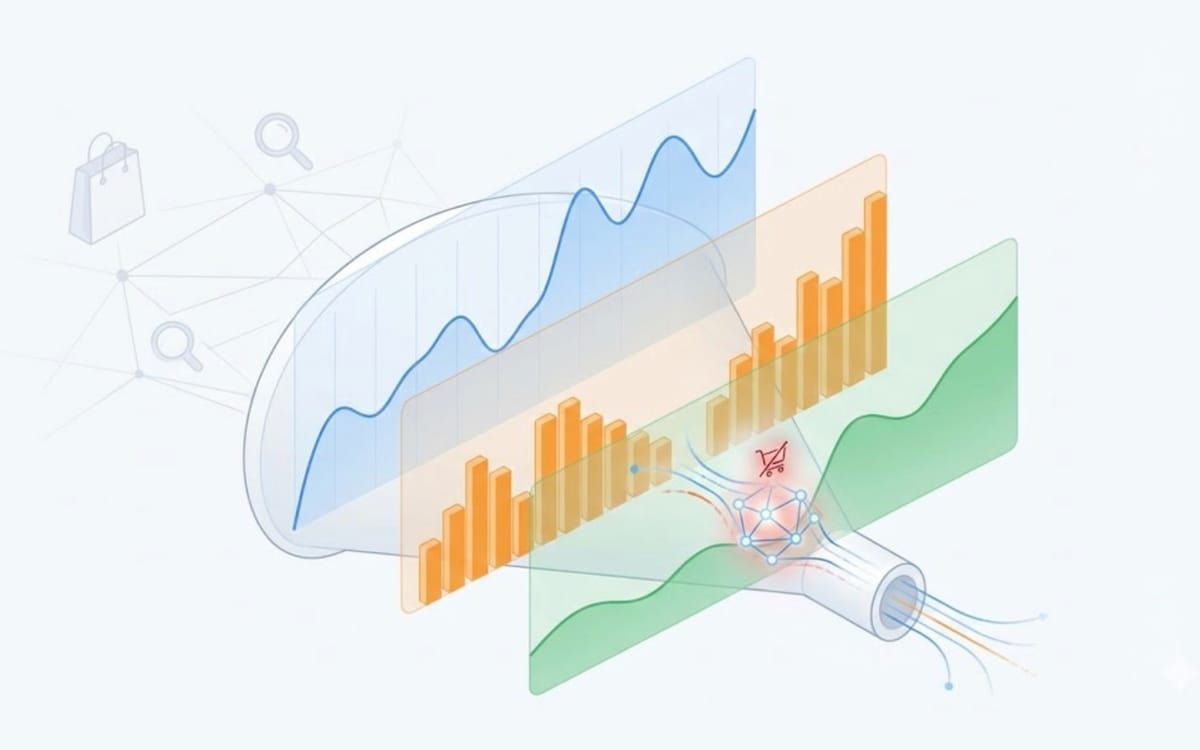
Shopify analytics and technical attribution challenges require diagnostic metric maps to identify checkout friction and traffic misalignment as platforms expand.

Shopify analytics and technical attribution challenges require diagnostic metric maps to identify checkout friction and traffic misalignment as platforms expand.
The maturation of the e-commerce ecosystem has created a technical paradox for digital merchants: an abundance of data that often obscures rather than clarifies the path to profitability. As retailers grapple with increasingly fragmented customer journeys, the necessity for diagnostic frameworks that go beyond surface-level metrics has intensified. According to a technical assessment on January 3, 2026, shared by Adriaan Dekker, a Google Ads specialist, "many issues in e-commerce only show up when two metrics overlap," revealing hidden patterns that a single data point would fail to capture.
This shift toward multi-dimensional analysis occurs as major commerce platforms introduce new layers of operational complexity. On December 10, 2025, Shopify launched its Product Network, a system that allows products from various merchants to appear across different storefronts. While such features expand reach, they also complicate the measurement of customer acquisition costs and conversion attribution. The integration of artificial intelligence into advertising further compounds these challenges. Google’s AI Max for Search, for instance, has faced scrutiny from advertisers for claiming credit for conversions that may have occurred through existing exact-match keywords.
To address these measurement gaps, Jetmetrics developed a series of 20 metric pairs designed to "validate what your metrics really mean" and "avoid false positives." These maps serve as a debugging tool for e-commerce performance, focusing on the intersection of traffic, behavior, and financial outcomes. According to the Jetmetrics framework, the goal is to "debug tricky trends faster" by identifying specific signals within the data stream.

The relationship between initial site entry and user engagement provides the first layer of diagnostic insight. According to the data provided by Dmitry Nekrasov, the following metric pairs identify specific traffic and content outcomes:
The analysis of session data versus revenue also provides insight into traffic quality. According to the Jetmetrics "cheat sheet," sessions that increase without a corresponding rise in revenue point toward "cheap traffic"—visitors who browse but lack the intent or capacity to convert. Conversely, when both conversion rates and revenue are high, but acquisition costs remain controlled, the result is "cheap conversions," which may be sustainable in the short term but require monitoring for long-term value.
Checkout friction remains one of the most significant barriers to e-commerce growth. According to the metric maps, specific overlaps can pinpoint exactly where this friction occurs in the transaction process.
These diagnostic tools are becoming essential as e-commerce platforms like Contentsquare bring AI analytics specifically to the Shopify checkout process. On December 17, 2025, Contentsquare announced a partnership with Shopify to provide behavioral measurement tools that track page load speeds and broken elements. By combining technical performance signals with behavioral data, merchants can quantify how specific errors impact conversion rates.
Buy ads on PPC Land. PPC Land has standard and native ad formats via major DSPs and ad platforms like Google Ads. Via an auction CPM, you can reach industry professionals.
The effectiveness of specific marketing channels can be decoded through behavioral overlaps. According to Dmitry Nekrasov, these pairs help identify when a channel strategy is failing to deliver on its promise.
The importance of audience precision is reflected in Google's expanded audience reporting in DV360, which now includes ten distinct categories like "Commerce" and "In-market." These classifications help advertisers better target segments to improve mobile and cross-channel outcomes.
Beyond the immediate transaction, long-term profitability is measured through the lens of customer lifetime value (LTV) and retention. According to the Jetmetrics framework, a high LTV paired with a high repeat rate indicates the presence of "high-ticket buyers" or the success of "better targeting" strategies. These segments represent the most profitable cohort for a brand.
However, high LTV does not always equate to high profit margins. A concerning pattern arises when high LTV is coupled with low margins, a situation classified as "unprofitable loyalty." This often occurs when a brand relies too heavily on aggressive discounting or loyalty programs that erode the bottom line to maintain volume.
Product quality itself is monitored through a specific diagnostic pair. According to the framework, a high return rate coupled with a low Customer Satisfaction (CSAT) score is a definitive sign of "product quality issues." This metric overlap identifies where the marketing promise and the physical product diverge, often leading to brand erosion.
The traditional approach to e-commerce analytics has often been descriptive—reporting what happened without explaining the root cause. The movement toward diagnostic analytics represents a change in how marketing teams approach optimization. According to industry analysis, instead of simply observing that conversion rates have declined, teams are now using these metric maps to identify whether the cause is technical checkout errors, poor product relevance, or misaligned traffic.
This diagnostic precision is necessary because platform-level reporting can sometimes be misleading. For instance, research examining ChatGPT referrals in e-commerce revealed that while the traffic showed favorable bounce rates, the conversion rates were lower than traditional organic and paid search channels. Without a multi-metric view—comparing bounce rate, session volume, and revenue per session—a merchant might over-invest in a channel that appears "relevant" but fails to drive financial outcomes.
Furthermore, Google’s "Think Week" announcements in late 2025 highlighted "AI Data Strength," which focuses on utilizing first-party data through enhanced manager tools. These tools allow retailers to connect data from Shopify and other sources to gain a holistic view of campaign performance. However, as the Jetmetrics framework suggests, the efficacy of these AI tools must be validated against real-world performance to avoid attribution errors.
The adoption of these technical diagnostic maps signifies a shift toward data literacy that is required to survive in an automated advertising environment. As IAB Europe updates the retail media landscape map to include more data collaboration tools, the ability to "validate what your metrics really mean" becomes a competitive advantage.
Marketers can no longer rely on single-point attribution. The complexity of new platform features, such as Shopify's Product Network, means that a conversion might be the result of a cross-merchant display that traditional models struggle to track. By using metric overlaps to debug tricky trends, retailers can distinguish between systemic technical failures and shifts in consumer behavior. This allows for more efficient budget allocation and more accurate forecasting of long-term brand health.
Subscribe PPC Land newsletter ✉️ for similar stories like this one
Subscribe PPC Land newsletter ✉️ for similar stories like this one