Ad-supported streaming now reaches 210 million U.S. viewers, VAB report finds
VAB's 12th annual streaming report shows 210M U.S. ad-supported viewers, cord-cutter majority, and CTV ad spend reaching 43% of TV budgets in 2026.

VAB's 12th annual streaming report shows 210M U.S. ad-supported viewers, cord-cutter majority, and CTV ad spend reaching 43% of TV budgets in 2026.
The Video Advertising Bureau released its 12th annual streaming analysis in March 2026, presenting 26 data points that map the state of ad-supported streaming in the United States. The report, titled "Rising Tides: 26 Streaming Insights That Are Impacting Marketing Plans in 2026," draws on research from eMarketer, MRI-Simmons, Inscape, Antenna, Comscore, and other third-party sources. It lands as advertising upfront season begins - a period when billions of dollars in commitments are made months in advance of broadcast.
The headline number is 209.4 million. That is eMarketer's estimate for the number of U.S. consumers using ad-supported video on demand services in 2026, according to the report. In 2023 the figure stood at 164.4 million. The increase represents a 27% gain over three years, and the trajectory shows no sign of plateauing - the same eMarketer dataset projects 216.3 million AVOD viewers by 2027, equivalent to 63% of the U.S. population.
Underlying that audience growth is a change in how American homes receive television. For the first time in 2026, non-pay-TV households outnumber pay-TV households in the United States. According to eMarketer data cited in the VAB report, non-pay-TV homes reached 70.8 million - or 53% of all households - against 63.4 million pay-TV homes. Two years earlier, in 2024, pay-TV held a 53-to-47 lead. The inversion happened in 2025 when both groups sat at exactly 66.6 million.
The population-level data is confirmed by survey results. MRI-Simmons' March 2026 Cord Evolution Study, which VAB analyzed, found that 59% of U.S. adults 18 and over now consider themselves "cordless." Within that group, cord cutters - those who cancelled a pay-TV subscription - account for 34 percentage points. Cord nevers, those who never subscribed at all, make up the remaining 25 points. PPC Land has tracked the linear TV decline through the QVC and HSN story, where traditional pay-TV audiences have contracted dramatically.
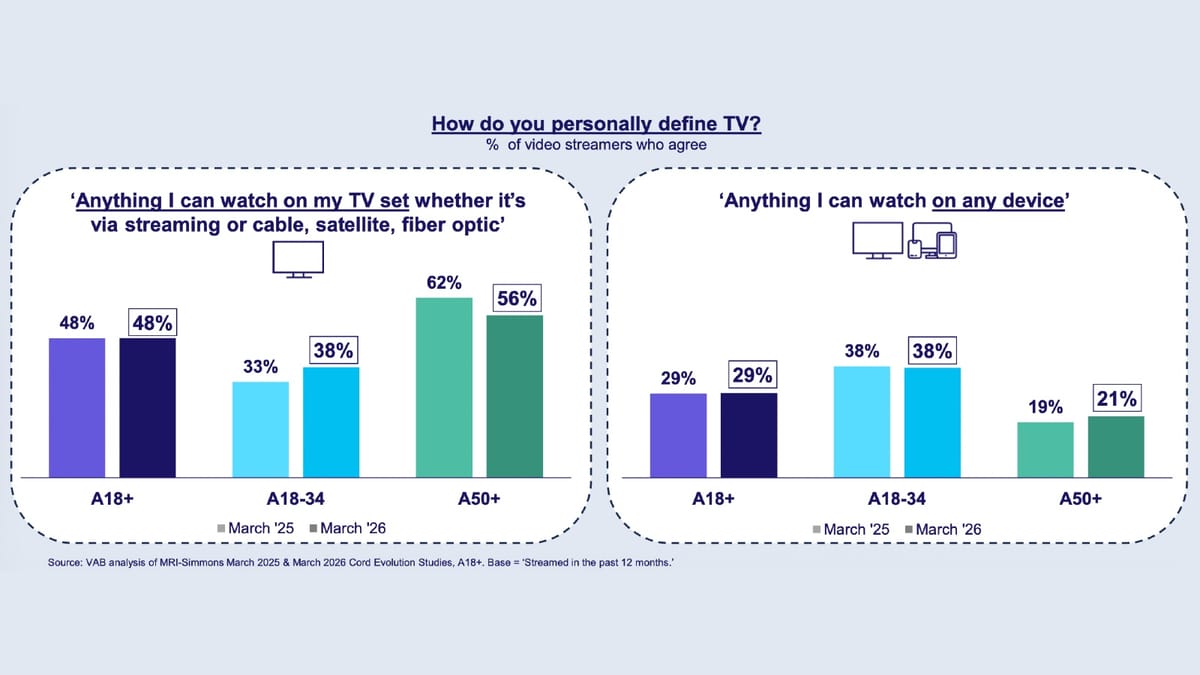
The definition of television is itself shifting, though more slowly than the distribution data might suggest. According to VAB's analysis of MRI-Simmons data, 48% of U.S. adults 18 and over defined "TV" in March 2026 as anything watchable on a TV set - whether via streaming, cable, satellite, or fiber optic. That figure is unchanged from March 2025 for the overall adult population. Among the 18-34 cohort, however, the set-based definition increased from 33% to 38% over the same twelve months, while the share defining TV as anything watchable on any device held steady at 38%. Younger adults are converging, in other words, toward a television-as-device conception rather than a television-as-content-anywhere model.
Smart TV hardware is driving that perception. According to S&P Global Market Intelligence Kagan estimates compiled in October 2025, the U.S. smart TV installed base stood at 250.2 million units in 2025 and is projected to reach 287.8 million by 2029. Smart TVs now represent 72% of the total TV set installed base in 2025, up from 64% in 2023 and 45% in 2017. The average number of smart TVs per household rose from 1.7 in 2015 to 2.4 in 2025. By 2029, that figure is projected to reach 2.5. Nielsen's 2026 upfront guide reinforces the smart TV's centrality, noting streaming accounts for 66.7% of all time spent with ad-supported TV among adults 18-49.
The device through which viewers access content has changed substantially. According to Hub Entertainment's "Decoding The Default" study published in August 2025, smart TV built-in apps were the default device for watching TV content for 30% of viewers in 2025, up from just 10% in 2020. Over the same period, the MVPD set-top box fell from 47% to 28% as the primary entry point. Streaming media players - Roku, Fire TV, Apple TV - edged slightly lower from 17% to 16%. The combined share of TV-based viewing (smart TV apps, MVPD set-top boxes, and streaming media players) held essentially constant at 74% across both years, meaning the shift is internal to TV rather than a flight toward mobile or laptop screens.
Inscape's TV Market Trends Report for Q3 2025 adds a panel-level precision to this picture. Streaming is now accessed on 85% of all TVs measured in Inscape's nationally representative panel - up from 83% in Q3 2024. More significantly, 36% of TVs in Q3 2025 received only streaming content with no cable, satellite, or OTA supplement. That share was 33% in Q3 and Q4 of 2024.
Session lengths on CTV platforms vary widely by app type. According to a VAB and TVision custom study measuring July 2024 through June 2025, virtual MVPD apps averaged session lengths of 1 hour and 26 minutes per session. FAST apps followed at 1 hour and 24 minutes. Hybrid SVOD/AVOD platforms averaged 1 hour and 11 minutes, while pure SVOD apps averaged exactly 1 hour. YouTube sessions on CTV averaged just 52 minutes. The gap between the longest and shortest session types is 34 minutes - an operationally significant figure for ad frequency planning. PPC Land has previously examined how this attention differential matters for buyers choosing between premium video and YouTube inventory.
Consumer usage of individual services has stabilized after a peak in 2023. MRI-Simmons data shows that the average number of streaming services used in the past 12 months fell from 13 in 2023 to 11 in both 2024 and 2025. That consolidation has not, however, narrowed the AVOD market's overall reach. Inscape panel data tracking the average number of apps used monthly per streaming TV device showed a range of 3.5 to 3.8 across the April 2024 to September 2025 period, with a seasonal peak of 3.8 during the November-January period. The pattern is consistent: viewers cycle through three to four services on any given device in any given month, with a slight uptick in colder months.
Despite the consolidation in total services used annually, 80% of U.S. adults still used three or more streaming services in the past 12 months, according to MRI-Simmons data from January 2026.
The composition of streaming subscriptions has flipped. Antenna's "State of Subscriptions: Adds and Ads" report from May 2025 tracked premium SVOD plan tier distribution across services including Discovery+, Disney+, Hulu, Max, Netflix, Paramount+, and Peacock. In 2023, 67% of subscriptions were ad-free and 33% were ad-supported. By 2025, ad-supported tiers accounted for 46% of all subscriptions - a 39% increase and a 13 percentage point swing in two years. Ad-free subscriptions now represent a bare majority at 54%.
The bundling dimension adds a further layer. Antenna's "State of Subscriptions: Premium SVOD - 2025 Year in Review," released in February 2026, found that 27% of premium SVOD subscriptions in Q4 2025 were bundled with at least one other service - up from 14% in Q4 2023, representing a 52% increase. In absolute terms, bundled subscriptions stood at 71 million in Q4 2025 against 194 million non-bundled subscriptions.
Consumer preference data aligns with these behavioral patterns. According to VAB's analysis of the MRI-Simmons March 2026 Cord Evolution Study, 68% of adults 18-24 agreed they prefer streaming free video content with ads rather than paying for a subscription without ads - up from 60% in March 2025. The shift was even sharper in the 25-34 cohort, rising from 60% to 70%. Adults 35 and over moved from 68% to 69%. Hub Entertainment's December 2025 "TV Advertising: Fact vs Fiction" study found that 68% of viewers would choose watching ads if it saved $4-5 per month, compared to 60% in December 2021. Netflix's ad tier trajectory has been well-documented, with the platform targeting double its advertising revenue in 2025 following its proprietary ad tech rollout.
The ad exposure point has moved earlier in the viewing session. According to ESHAP Media's "War and Peace: The 2026 Agenda" published January 5, 2026, 95% of U.S. CTVs now display advertising on the home screen when the TV is turned on - before the viewer has navigated to any content. In 2020 that figure was 50%. Home screen advertising has effectively become the default opening impression of the television experience.
FAST channels - free ad-supported streaming TV - have expanded sharply alongside this trend. VAB's own October 2025 analysis, "Free For All: Understanding the Growth of FAST Through Three Key Questions," found a 57% increase in the number of FAST channels between 2023 and 2025, a 19% increase in FAST viewers between 2022 and 2025, a 54% increase in time spent with FAST over the same period, and a 25% increase in average channel session duration compared to 2024. FAST channels have also reached meaningful scale in Europe, where ShowHeroes research found 27% average monthly reach across five major markets.
Streaming's share of total national ad time is rising incrementally but measurably. Comscore's "Scoreboard" report from February 2026 tracked rolling four-week periods from September through December 2025. In September 2025, streaming's share of national ad time across its 50 measured networks stood at 16%. By December 2025 it reached 18%, a 2 percentage point increase across a single quarter. Broadcast held 47% in December, down from 48% in November. Cable fell from 39% in September to 35% in December. The holiday period systematically lifts streaming's ad time share.
The longer-run spending trajectory is more pronounced. eMarketer's December 2025 projections for U.S. TV and CTV ad spending show CTV moving from $20.0 billion (23% of total TV ad spend) in 2022 to $38.0 billion (43%) in 2026 and a projected $47.6 billion (53%) by 2028. Traditional TV spend is projected to contract from $66.6 billion in 2022 to $43.1 billion in 2028. Total TV ad spend - the sum of both - stays nearly flat across the period, moving from $86.6 billion in 2022 to $90.7 billion in 2028, suggesting the industry is undergoing a distribution shift rather than overall contraction. IAB Tech Lab's December 2025 CTV ad format standardization effort reflects the infrastructure work required to support this spending shift at scale.
One of the fastest-growing components of CTV advertising is retail media. eMarketer's December 2025 estimates for U.S. retail media CTV ad spending project growth from $4.5 billion in 2025 to $6.0 billion in 2026, $7.3 billion in 2027, $8.3 billion in 2028, and $9.0 billion in 2029 - effectively doubling over five years. The convergence of retail data with CTV inventory is documented in a growing body of platform activity. PPC Land has reported on how retail media and CTV are converging technically and commercially, with retail media spend on CTV projected to grow three times faster than retail media search.
The content drivers behind streaming growth are shifting. Movies remain the top reason consumers use or subscribe to a streaming service, cited by 55% of streamers in the March 2026 MRI-Simmons survey. But that figure declined from 61% in March 2025. Acquired content fell from 52% to 49%, and original series exclusive to the service dropped from 52% to 46%. Sports, by contrast, rose from 31% to 36% - a 5 percentage point increase. National news moved from 12% to 14%.
Live sports streaming is gaining audience breadth. Among streaming sports viewers, the NFL remained the most-streamed league, with 76% having streamed NFL content live in the 12 months before the March 2026 study, up from 72% in March 2024. NBA viewership on streaming rose from 33% to 41%, MLB from 35% to 41%, NCAA Basketball from 19% to 23%, and WNBA from 9% to 14%. Sixty percent of all streamers say they like to stream live sports, while 40% had done so in the past month. CTV app distribution for sports has broadened accordingly, with general SVOD apps used for sports streaming by 68% of sports streamers in 2025, up from 61% in 2024, according to LG Ad Solutions' "Stadium to Screen" report.
Multicultural audiences now account for 55% of adult 18-34 streamers, up from 49% in March 2025, according to VAB's analysis of MRI-Simmons data. Among all adults 18+, the multicultural share of the streaming population rose from 39% to 42% between March 2025 and March 2026 - slightly above the 40% multicultural share of the total adult population.
Streaming is also functioning as a communal activity. Tubi's "The Stream 2026: When Intention Becomes Attention," released in March 2026, found that 75% of streaming adults said household members use streaming together as a form of quality time - a 4% year-over-year increase. More strikingly, 52% said they are watching with people they do not live with, such as visiting a friend's home - a 15% year-over-year increase.
The co-viewing differential between platform types is measurable. A VAB and TVision custom study measuring July 2024 through June 2025 found that co-viewing - defined as the percentage of total impressions occurring with another viewer in the room - stood at 60% for premium video platforms and 45% for YouTube. That is a 33% co-viewing advantage for premium video. PPC Land has examined what this means for CTV advertisers, where attention-based targeting and shared-screen dynamics interact in ways not captured by standard impression metrics.
The VAB data makes several structural facts legible simultaneously. First, the AVOD audience has crossed a scale threshold - 209.4 million people, or 62% of the U.S. population, gives ad-supported streaming a reach comparable to linear television at its commercial peak. Second, the ad-preference shift is consumer-driven, not just platform-driven: majorities across all adult age groups now prefer free streaming with ads over paid ad-free alternatives when a $4-5 monthly saving is on the table. Third, the CTV spending trajectory points toward parity with traditional TV within two to three years, but the measurement and targeting infrastructure is still maturing.
CTV's measurement challenges remain active, with industry analysis estimating approximately $1 billion in annual waste from impressions delivered to screens that are off. The conversion gap is also a live issue, with IAB Europe's CTV Working Group finding that cross-device attribution gaps and fragmented identifiers still block CTV's full transition to a performance channel. Global content spend by streaming services reached 40% of the total in 2026 - $101 billion against $154 billion for all other media - according to Ampere Analysis data from January 2026.
The VAB report arrives as advertisers are making upfront commitments for the coming broadcast year. The 26 data points it assembles are drawn from more than a dozen third-party sources spanning consumer surveys, panel data, subscription databases, and ad spend forecasts.
Who: The Video Advertising Bureau (VAB), headquartered at 220 East 42nd Street, New York, NY 10017, produced the report. Research contributors include eMarketer, MRI-Simmons, Inscape, Antenna, Comscore, Ampere Analysis, Hub Entertainment, Tubi, LG Ad Solutions, and ESHAP Media, among others.
What: VAB's "Rising Tides: 26 Streaming Insights That Are Impacting Marketing Plans in 2026" is a 36-page data report organized across four sections - audience definitions and cord-cutting, device and platform behavior, the growth of ad-supported streaming, and content quality and live sports. The report documents 209.4 million U.S. AVOD viewers in 2026, the inversion of pay-TV and non-pay-TV households, a 46% ad-supported share of premium SVOD subscriptions, a 95% share of CTVs showing home screen advertising, and a projected CTV ad spend of $38.0 billion in 2026.
When: The report is dated March 2026. VAB distributed it to subscribers on March 31, 2026.
Where: The analysis covers the United States market unless otherwise specified. Global content spend data from Ampere Analysis is noted as worldwide. FAST growth data from VAB's October 2025 analysis is U.S.-focused.
Why: The report is published in time for the U.S. television upfront season, when advertising budgets for the coming broadcast year are committed. VAB positions the data as evidence that ad-supported streaming has reached a scale, preference, and behavioral depth that warrants significant advertising investment - and that audience, device, content, and spending signals across 2025 and into 2026 consistently point in the same direction.