AI crawlers now consume 4.2% of web traffic as internet grows 19% in 2025
Cloudflare's 2025 analysis reveals AI bots originated 4.2% of HTML requests while global internet traffic expanded 19%, with post-quantum encryption reaching 52% adoption.

Cloudflare's 2025 analysis reveals AI bots originated 4.2% of HTML requests while global internet traffic expanded 19%, with post-quantum encryption reaching 52% adoption.
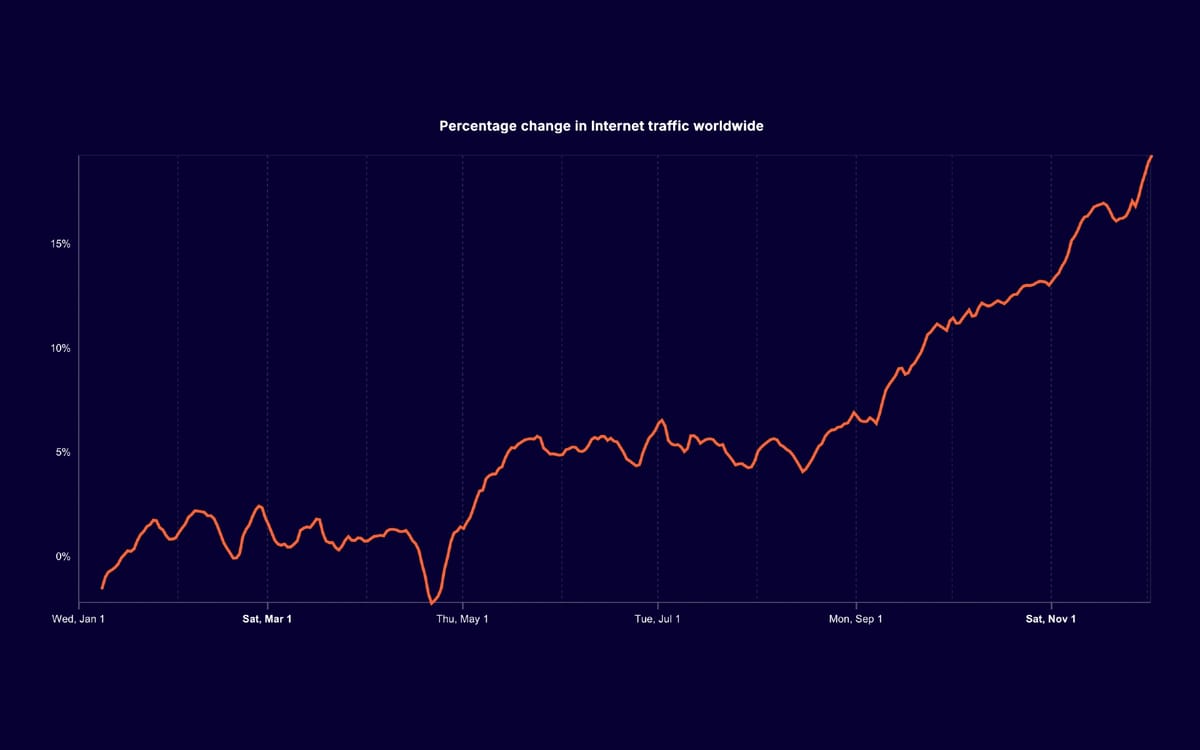
Global internet traffic expanded 19% throughout 2025, with artificial intelligence crawlers accounting for 4.2% of all HTML requests across Cloudflare's network, according to data published by the infrastructure company. The findings emerged from Cloudflare's annual Year in Review report analyzing patterns across its global network infrastructure.
AI bot activity represented a measurable shift in internet traffic composition. Human users generated 43.5% of HTML requests, while non-AI automated systems accounted for 47.9%. GoogleBot, which crawls for both traditional search indexing and AI model training purposes, originated 4.5% of requests. The analysis excluded GoogleBot from the AI bot category due to its dual functionality.
Subscribe PPC Land newsletter ✉️ for similar stories like this one
Training emerged as the dominant crawl purpose among AI bots. According to normalized traffic measurements, training activity significantly exceeded search-related crawling and user-directed actions throughout the year. Search bots retrieved content to support conversational platform capabilities and retrieval-augmented generation systems. User action bots accessed web content as part of tasks directed by human users through AI platforms.
The traffic analysis revealed concentration among major AI operators. GPTBot from OpenAI, ClaudeBot from Anthropic, and Meta-ExternalAgent from Meta appeared among the highest-traffic AI crawlers. ByteDance's Bytespider, Amazon's Amazonbot, and Apple's Applebot also demonstrated substantial crawling volumes. Traditional search engine crawlers GoogleBot and BingBot maintained higher overall traffic levels than specialized AI training systems.
Cloudflare analyzed robots.txt files across 3,879 of the top 10,000 domains to measure website operator responses to AI crawling activity. The analysis classified directives as fully allowed when the wildcard character appeared, fully disallowed when all paths were blocked, or partially allowed/disallowed when specific paths received different treatment. Results showed varied approaches among website operators regarding AI crawler access.
The crawl-to-refer ratio metric compared crawl requests from platform-owned bots against referral traffic from those platforms back to websites. Anthropic, OpenAI, and Perplexity showed ratios ranging from 10:1 to over 100:1, indicating these platforms crawled substantially more content than they referred traffic back to source websites. Microsoft, Google, and ByteDance demonstrated different ratios reflecting their distinct platform architectures and traffic patterns.
Security measures handled 6.2% of global traffic as mitigated during 2025. DDoS mitigation techniques and Web Application Firewall managed rules addressed 3.3% of traffic specifically. The gaming and gambling sector, categorized under "People and Society" organizations, experienced the highest targeting rates among industry verticals according to weekly aggregated data.
Network-layer DDoS attacks reached peak sizes of 31 terabits per second during 2025, representing approximately tenfold growth from a bytes perspective compared to the previous year. Packet-based attack sizes grew over sevenfold. Cloudflare defines hyper-volumetric attacks as those exceeding one terabit per second or one billion packets per second operating at Layer 3/4 of the network stack.
Buy ads on PPC Land. PPC Land has standard and native ad formats via major DSPs and ad platforms like Google Ads. Via an auction CPM, you can reach industry professionals.
Post-quantum encryption adoption accelerated dramatically throughout the year. By November, 52% of TLS 1.3 traffic utilized post-quantum key agreement methods designed to protect encrypted data from future quantum computer capabilities. Cloudflare enabled post-quantum key agreement on its network by default in October 2022, but adoption required browser support. The rapid growth in usage corresponded with major browsers enabling default support for the cryptographic techniques.
Resource Public Key Infrastructure adoption progressed steadily across both IPv4 and IPv6 address spaces. The global share of RPKI-valid IPv4 routes reached 53.9% by year-end, up 3.9 percentage points from 2024. IPv6 adoption rates achieved 60.1%. RPKI provides cryptographic methods for signing records that associate BGP route announcements with correct originating autonomous system numbers, enabling network providers to validate announcements and reject invalid routes.
Internet traffic growth calculations excluded early January to normalize activity following the return to work and school after New Year. The 19% expansion reflected continued global reliance on internet connectivity for communication, commerce, entertainment, and transportation. Traffic measurements used aggregate request volumes from Cloudflare's infrastructure serving millions of customer websites and applications.
SpaceX Starlink satellite internet service demonstrated 2.3x traffic growth during 2025 as measured through autonomous system AS14593. Cloudflare analyzed aggregate request traffic volumes from locations where Starlink provides connectivity, particularly previously underserved or unserved areas. Service availability remains limited globally, and traffic data appears only for regions where Cloudflare observed meaningful Starlink-related activity.
Popular internet services maintained established hierarchies with some notable shifts. Google retained its position as the most popular internet service globally, followed by Facebook and Apple. Instagram climbed within the top 10 rankings during 2025, alongside YouTube. WhatsApp entered the global top 10 for the first time. TikTok remained among the leading services.

Generative AI platforms continued rapid growth. Claude, Perplexity, and Gemini emerged as primary competitors to ChatGPT in the conversational AI category. The ranking methodology relied on aggregate data from Cloudflare's 1.1.1.1 DNS resolver service analyzing request patterns across internet services.
Social media platforms showed shifting engagement patterns. After Facebook, Instagram, and TikTok, Snapchat demonstrated stronger performance than X (formerly Twitter) in traffic measurements. Roblox maintained dominance in metaverse and gaming categories despite competition from other platforms.
Mobile device traffic accounted for 43% of global requests, while desktop systems generated 57%. Nearly 117 countries showed majority traffic from mobile devices. Operating system distribution revealed Android commanding 65% of mobile traffic globally, with iOS accounting for 35%. Peak Android adoption reached 97% in certain markets, while iOS peaked at 70% in higher-income regions.
HTTP protocol adoption showed continued migration toward newer versions. HTTP/3 usage reached 21% of requests globally, while HTTP/2 remained dominant at 50%. Legacy HTTP/1.x versions accounted for 29% of traffic. HTTP/3's use of QUIC transport protocol enables faster connection establishment, improved packet loss mitigation, and default encryption.
IPv6 adoption achieved 29% of dual-stack traffic during 2025. The analysis examined requests for content available over both IPv4 and IPv6, calculating aggregate adoption rates. Limited IPv4 address space availability has prompted some cloud providers to implement charges for IPv4 address usage, accelerating IPv6 migration incentives.
Browser market share data showed Chrome commanding 66.2% globally, followed by Safari at 15.4%, Edge at 7.4%, Firefox at 3.7%, and Samsung Internet at 2.3%. Search engine market share demonstrated Google's dominant position at 89.5%, with Bing at 3.1%, Yandex at 2%, Baidu at 1.4%, and DuckDuckGo at 1.2%. Cloudflare's methodology uses Referer headers to identify search engines sending traffic to customer sites.
Internet outages affected global connectivity 174 times during 2025. Government-directed shutdowns accounted for 83 major disruptions, representing the largest single cause category. Power outages caused 25 disruptions, while cable cuts resulted in 19 incidents. Technical problems, weather events, fires, natural disasters, cyberattacks, misconfigurations, network issues, maintenance activities, and DNS problems caused smaller numbers of disruptions.
Email security analysis classified 5.6% of messages as malicious on average throughout the year. Deceptive links appeared in 52% of malicious emails, making it the most prevalent threat category. Identity deception affected 38.3% of malicious messages, while brand impersonation appeared in 32.3%. Domain age analysis flagged 22.3% of malicious emails, and credential harvesting attempts accounted for 18.9%.
Top-level domain abuse patterns identified .christmas as originating the largest share of malicious and spam email messages among the nearly 1,600 TLDs tracked. Other frequently abused domains included .lol, .forum, .help, .best, .click, .cfd, .icu, .autos, and .sbs. The analysis examined billions of email messages processed by Cloudflare Email Security during the year.
Bot traffic source distribution showed 71% originating from the top 10 countries. The United States generated 40% of global bot traffic, followed by Germany at 6.5%, Singapore at 4.1%, Netherlands at 3.8%, and Ireland at 3.2%. China, India, United Kingdom, Russian Federation, and Brazil completed the top 10 source countries.
Autonomous system analysis revealed significant bot traffic concentration among cloud platform providers. Amazon's AS16509 generated 9.2% of global bot traffic, while Microsoft's AS8075 produced 5.5%. Amazon's AS14618 accounted for 5.2%, Google's AS15169 contributed 4.9%, and Google Cloud Platform's AS396982 generated 4.8%. Cloudflare's own AS13335 originated 3.4% of bot traffic.
Internet quality measurements analyzed download speeds, upload speeds, idle latency, and loaded latency from tests conducted through speed.cloudflare.com. Spain recorded the highest median download speed at 318 Mbps, followed by Hungary at 305 Mbps, Portugal at 297 Mbps, Chile at 271 Mbps, and South Korea at 260 Mbps. The measurements relied on user-initiated speed tests throughout 2025.
Speed test activity mapping revealed concentration in several global regions. The London area recorded the highest test volume, with substantial activity also visible in the United States, Hong Kong, and Japan. Cloudflare aggregated speed test activity at sub-national levels, displaying locations recording over 100 tests per week. The visualization used marker sizing to represent test volume.
Website technology analysis examined the top 5,000 domains to identify popular frameworks, platforms, and services. Google Analytics dominated the analytics category at 37% adoption, followed by Facebook Pixel at 11% and LinkedIn Insight Tag at 10%. JavaScript library and framework adoption, content management systems, cookie compliance tools, and other technology categories showed varied distributions among leading websites.
API client development showed Go as the most popular programming language at 20% of automated API traffic. Python accounted for 17%, Java represented 11%, Node.js comprised 8.3%, and .NET reached 2.3%. The analysis examined automated API traffic patterns to determine which languages developers use to create API clients, excluding browser-based and mobile application traffic.
Workers AI model popularity tracked publicly available models based on customer account usage share. The @cf/meta/llama-3-8b-instruct model dominated adoption, followed by @cf/openai/whisper for automatic speech recognition and @cf/microsoft/resnet-50 for image classification. Text generation emerged as the most popular task category, followed by text-to-image generation and automatic speech recognition.
The analysis covered internet patterns and trends observed through Cloudflare's global network throughout 2025. Traffic data, security measurements, technology adoption metrics, and infrastructure observations provided comprehensive visibility into internet usage patterns affecting billions of users worldwide.
AI crawler activity represented a measurable component of overall internet traffic composition, with distinct patterns emerging across training, search, and user action purposes. The concentration of traffic among major AI operators reflected the competitive landscape of large language model development and deployment.
Security challenges persisted throughout the year despite advancing defensive technologies. The growth in hyper-volumetric DDoS attack sizes demonstrated escalating capabilities among threat actors. Email-based threats maintained consistent prevalence, with deceptive links and identity deception remaining primary attack vectors.
Encryption adoption progressed substantially with post-quantum cryptography reaching majority adoption in TLS 1.3 traffic. The rapid growth demonstrated industry responsiveness to emerging quantum computing threats and browser vendors' commitment to implementing advanced security standards.
Internet infrastructure continued evolving with HTTP/3 gaining adoption and IPv6 usage expanding. Mobile device dominance in numerous markets reflected global connectivity patterns, while desktop systems maintained majority traffic share globally. Browser and search engine markets showed stable hierarchies with Chrome and Google maintaining dominant positions.
Government-directed internet shutdowns represented the largest single cause of major connectivity disruptions, affecting numerous countries throughout the year. These deliberate outages raised ongoing concerns about internet access rights and government censorship capabilities.
The commercial internet ecosystem demonstrated continued growth with advertising markets expanding and new platforms emerging. AI search channels showed early adoption patterns affecting traditional search traffic distribution. Marketing professionals adapted strategies to account for changing traffic sources and user behavior patterns.
Bot traffic concentration among cloud infrastructure providers reflected the computational requirements of automated systems. The distribution across autonomous systems highlighted how major cloud platforms host significant portions of internet automation activity.
Website operators faced decisions about AI crawler access policies. The diversity of approaches in robots.txt files demonstrated varied perspectives on balancing content accessibility against concerns about AI training data usage. Publishers continued debating strategies for managing crawler access as AI platforms proliferated.
The crawl-to-refer ratio metric provided quantitative measurement of platform behavior regarding content consumption versus traffic referral. Platforms showing high ratios consumed substantially more content through crawling than they returned through referral traffic, raising questions about value exchange between AI systems and content creators.
Email security remained critical as threat actors employed diverse techniques to compromise users. The prevalence of deceptive links and identity deception highlighted ongoing effectiveness of social engineering approaches. Top-level domain abuse patterns suggested certain domain extensions attracted disproportionate malicious activity.
Internet quality varied significantly across global markets, with European and Asian countries achieving highest download speeds. The measurements reflected infrastructure investment levels, regulatory environments, and competitive dynamics in telecommunications markets. User-initiated speed testing provided distributed measurement points for connectivity quality assessment.
Technology adoption patterns among leading websites showed concentration around established platforms and services. Google Analytics' dominance reflected the platform's market position and feature set. Diverse technology stacks across categories indicated website operators' varied technical requirements and strategic priorities.
Satellite internet expansion through Starlink demonstrated 2.3x traffic growth as the service extended connectivity to underserved regions. The autonomous system analysis provided visibility into satellite internet adoption patterns and usage growth trajectories.
Protocol evolution continued with HTTP/3 capturing growing market share. The transition from HTTP/2 and legacy HTTP/1.x versions demonstrated gradual adoption of newer standards offering performance and security improvements. QUIC's properties enabled faster connections and better handling of network conditions.
Subscribe PPC Land newsletter ✉️ for similar stories like this one
Subscribe PPC Land newsletter ✉️ for similar stories like this one
Who: Cloudflare, a global internet infrastructure company serving millions of customers, published its 2025 Year in Review analyzing traffic patterns, security trends, and technology adoption across its network. AI companies including OpenAI (GPTBot), Anthropic (ClaudeBot), Meta (Meta-ExternalAgent), ByteDance (Bytespider), Amazon (Amazonbot), and Apple (Applebot) operated major crawling systems consuming web content for training and search purposes.
What: Global internet traffic expanded 19% during 2025, with AI bots originating 4.2% of HTML requests while human users generated 43.5% and non-AI automated systems accounted for 47.9%. Post-quantum encryption adoption reached 52% of TLS 1.3 traffic, network-layer DDoS attacks peaked at 31 terabits per second, and 174 major internet disruptions occurred with government-directed shutdowns representing the largest category at 83 incidents. The analysis covered traffic patterns, security measurements, email threats, protocol adoption, device usage, bot traffic sources, and internet quality metrics.
When: The data encompasses calendar year 2025, with traffic growth measurements beginning mid-January to normalize post-holiday activity. Post-quantum encryption adoption accelerated following Google Chrome 124's default enablement in April, while RPKI adoption progressed throughout the year. The Year in Review report was published by Cloudflare analyzing patterns observed across its global network infrastructure during the twelve-month period.
Where: The analysis covered worldwide internet traffic patterns observed through Cloudflare's global network infrastructure. Geographic measurements included bot traffic sources (United States 40%, Germany 6.5%, Singapore 4.1%), internet quality data (Spain highest download speeds at 318 Mbps), speed test activity concentration (London area recorded highest volumes), mobile device dominance (117 countries showed majority mobile traffic), and IPv6 adoption (29% of dual-stack traffic globally). Satellite internet expansion through SpaceX Starlink extended connectivity to previously underserved regions worldwide.
Why: The comprehensive analysis matters because it quantifies fundamental shifts in internet infrastructure, security threats, and traffic composition affecting billions of users and millions of websites globally. AI crawler activity reaching 4.2% of HTML requests represents a measurable shift in how automated systems consume web content, with implications for content creators, publishers, and website operators managing crawler access policies. Post-quantum encryption adoption addresses emerging quantum computing threats to encrypted data. DDoS attack growth demonstrates escalating capabilities among threat actors requiring defensive measures. Government-directed internet shutdowns affecting 83 major disruptions raise concerns about connectivity rights and censorship. The data provides marketing professionals, security teams, infrastructure operators, and policy makers with quantitative measurements of internet usage patterns, emerging threats, and technology adoption trajectories shaping digital commerce, communication, and information access.