According to Pixis, a comprehensive analysis of $996 million in Google Ads spending across 100 consumer brands reveals dramatic cost variations between industries and campaign types. The data, spanning January 2024 through February 2025, shows average Google CPM at $11.12 and CPC at $0.73, though these figures mask substantial differences when examined by sector.
Food & Beverage brands emerged as the highest spenders with $214 million invested, but faced the steepest costs with CPMs reaching $28.59 and CPCs hitting $3.07. Healthcare Services commanded even higher rates, with CPMs of $36.82 representing the dataset's peak pricing. Conversely, Online Marketplaces benefited from remarkably low costs at $2.71 CPM and $0.14 CPC.
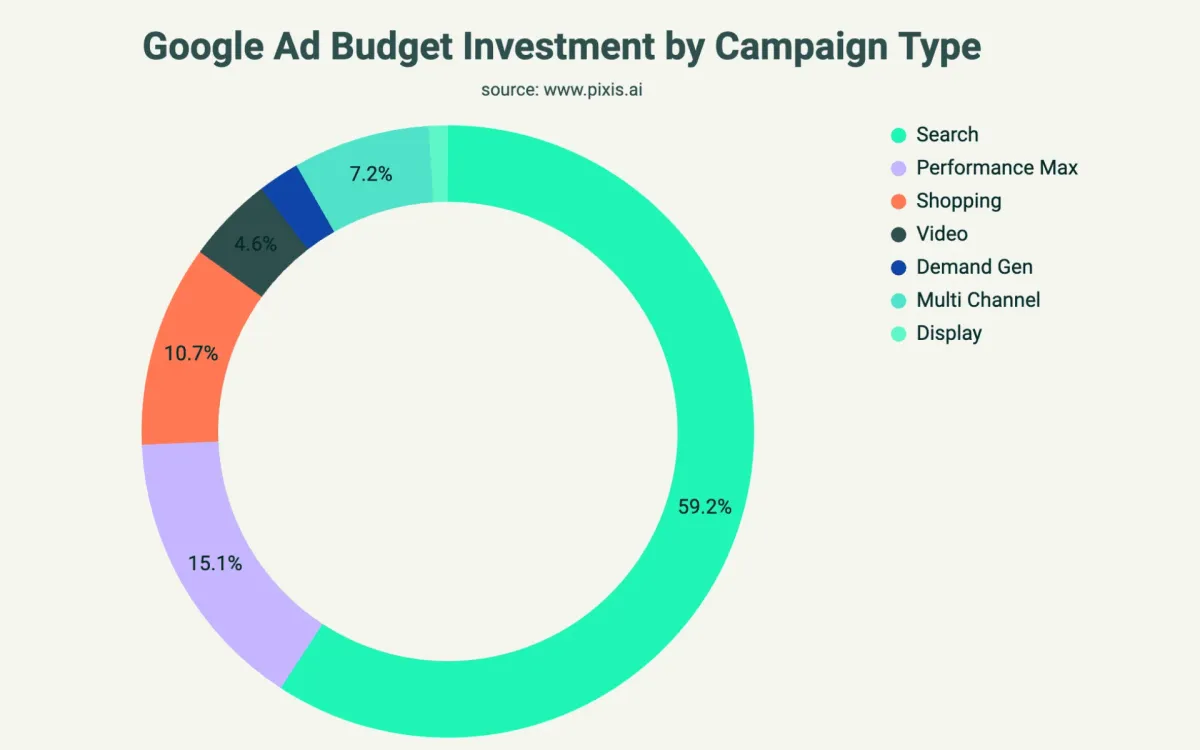
The analysis encompasses search, display, shopping, Performance Max, and video campaigns across Google's advertising ecosystem. Search campaigns dominated spending patterns, capturing 56.2% of total Google ad investment despite their premium pricing structure. Performance Max campaigns maintained consistent 13-18% monthly spend allocation, falling short of Google's promotional expectations for the AI-driven format.
Subscribe PPC Land newsletter ✉️ for similar stories like this one. Receive the news every day in your inbox. Free of ads. 10 USD per year.
Subscribe
Search advertising's dominance reflects advertisers' confidence in high-intent targeting, though costs remain substantial. Display campaigns offered the most economical option with average CPMs of just $2.54, while Shopping Ads secured 10.3% of budgets particularly within retail categories including Footwear, Furniture, and Marketplaces.
Bidding strategy preferences leaned heavily toward automation, with Maximize Conversions and Target ROAS each capturing approximately 33% of spending. Target CPA strategies accounted for roughly 10% of usage, while Maximize Conversion Value secured 15% of advertiser allocation. Manual CPC approaches represented minimal usage within the dataset, though this reflects potential selection bias given Pixis's focus on AI-driven campaign management.
The coefficient of variation methodology measured price volatility across industries. Food & Beverage demonstrated 21% CPM variation, providing relatively predictable budgeting despite high absolute costs. Healthcare showed greater stability in this metric, while Software recorded the lowest volatility at 7% CPM variation.
Healthcare and software drive premium pricing
Healthcare advertising commanded premium positioning with $148.2 million in total spending and $36.82 average CPMs. Click-through rates reached 2.43% in this sector, indicating strong audience engagement despite elevated costs. The regulated nature of healthcare advertising and competitive landscape for medical services contribute to these pricing dynamics.
Software companies demonstrated extreme metrics with CPMs reaching $383.24 and CPCs at $3.88. Click-through rates averaged 9.88% in this category, largely driven by branded search allocation. The analysis notes that customer lifetime value and profit margins influence software advertising costs beyond simple competition factors.
Travel & Hospitality enjoyed favorable economics with $65.1 million spending generating $4.50 CPMs and $0.25 CPCs. This sector achieved 1.12% click-through rates while benefiting from seasonal demand patterns. The tourism industry's recovery following recent global disruptions may contribute to these cost-effective rates.
Jewelry & Luxury Goods invested $79.1 million with $14.33 CPMs and $1.48 CPCs. The sector experienced notable divergence between CPM volatility at 24% and CPC volatility at just 9%, indicating seasonal competition effects particularly around holiday shopping periods in North America.
Performance Max adoption remains limited despite promotion
Performance Max campaigns consistently held 13-18% of monthly Google spending throughout the analysis period. Despite aggressive promotion from Google, adoption rates remained steady without significant growth trajectory. The format delivered lower average CPMs at $8.69 and CPCs at $0.66 compared to other campaign types, but transparency limitations hindered broader implementation.
According to Chris Parrett, CEO of Social Hustle, "We're watching the collapse of reliable data signals. We need better signals, better clarity, better attribution." This sentiment reflects broader advertiser concerns about Performance Max's attribution opacity despite its cost efficiency advantages.
The analysis reveals that marketers prefer campaign types offering clearer performance insights over purely cost-driven decisions. Shopping campaigns demonstrated strong performance for retail-heavy categories, while Display maintained cost advantages for awareness-focused objectives. Video campaigns showed promise for engagement metrics though specific performance data varies by implementation.
Buy ads on PPC Land. PPC Land has standard and native ad formats via major DSPs and ad platforms like Google Ads. Via an auction CPM, you can reach industry professionals.
Learn more
Industry-specific tactical considerations emerge from data
Beauty & Personal Care brands invested $38.8 million with CPMs at $13.56 and CPCs reaching $2.08. Competitive pressure in this sector drives elevated costs, though specific click-through rate data wasn't fully detailed in the source material for this category.
Automotive advertising totaled $49.6 million with $14.30 CPMs and $0.92 CPCs. Lead generation focus influenced bidding strategies, with conversion-focused approaches dominating this sector. The analysis suggests Target CPA and Maximize Conversions strategies align well with automotive sales funnel requirements.
Furniture & Home Décor companies spent $69.5 million generating $15.96 CPMs and $0.98 CPCs. Click-through rates reached 1.63% with Shopping campaigns performing particularly well. The seasonal nature of home improvement spending contributes to this sector's performance patterns.
Apparel & Accessories allocated $37.9 million toward Google advertising, resulting in $20.74 CPMs and $1.64 CPCs. Volatility remained relatively controlled with 12% CPM variation and 7% CPC variation, enabling more predictable budget planning compared to other retail categories.
Gaming demonstrates unique multi-channel approach
Gaming brands invested $19 million exclusively in multi-channel Google campaigns across the dataset. This sector achieved $10.39 CPMs and notably low $0.59 CPCs through their comprehensive channel strategy. Click-through rates reached 1.76%, suggesting effective audience targeting across YouTube and Display networks.
The gaming industry's complete multi-channel focus represents an outlier approach within the analysis. Visual campaign formats naturally align with gaming marketing requirements, though the sample size limits broader industry conclusions. User-generated content performed well for gaming advertisers within the dataset.
Pet Care advertising showed extreme metrics with just $22 million spending but $52.77 CPMs and $2.47 CPCs. The analysis notes potential bias due to small sample size of two brands, suggesting caution when interpreting these figures. Click-through rates reached 2.13%, indicating strong engagement despite elevated costs.
Office Supplies & Stationery invested $19.3 million with $17.41 CPMs and $2.04 CPCs. Lower seasonality contributed to reduced volatility at 11% for both CPM and CPC metrics. This stability enables more consistent budget allocation throughout the year compared to fashion or retail categories.
Economic context influences advertising investment patterns
The broader economic environment affects Google advertising costs across all sectors examined. According to the analysis, inflation impacts contribute to elevated pricing structures beyond simple competitive dynamics. These macro-economic factors compound industry-specific competition to drive overall cost increases.
Google Ads costs have continued rising throughout 2025, with additional benchmark studies showing 12.88% cost per click increases across industries. This trend aligns with Pixis findings regarding elevated pricing across most sectors examined in their comprehensive analysis.
Cross-channel competition influences Google pricing as advertisers evaluate platform performance. Meta advertising costs also demonstrate upward trends, though Google maintains higher engagement rates according to the comparative data. This platform dynamic affects budget allocation decisions across marketing organizations.
The analysis period from January 2024 through February 2025 captures significant industry changes including AI feature implementations and privacy regulation updates. These technological and regulatory shifts influence both advertiser behavior and platform pricing mechanisms.
AI integration reshapes campaign management approaches
Artificial intelligence tools increasingly support Google advertising optimization beyond Performance Max campaigns. The analysis suggests that creative differentiation becomes more critical as automation handles technical campaign management. Generative AI enables more creative variations without quality sacrifice, potentially improving engagement rates.
Building comprehensive AI strategies emerged as essential for competitive advertising performance. Google's algorithmic bidding drives most campaign optimization, but marketers require additional AI platforms providing transparency and cross-channel insights. This need drives demand for third-party AI marketing tools offering decision support capabilities.
The role of human strategy increases even as tactical optimization becomes automated. Campaign architecture and creative input require strategic thinking, while AI handles bid adjustments and audience targeting refinements. This division of responsibility represents the future direction for Google advertising management.
According to the analysis, "Benchmarks are your starting line. The next step is turning them into smarter, faster, context-driven action." This perspective emphasizes the importance of applying benchmark data strategically rather than treating it as definitive performance targets.
Pricing volatility demands strategic flexibility
Cost volatility varies significantly between industries, requiring sector-specific budgeting approaches. Healthcare and Food & Beverage demonstrate different volatility patterns despite both commanding premium pricing. Furniture and Travel show more stable pricing environments enabling longer-term budget commitments.
The coefficient of variation methodology provides frameworks for understanding price stability within each sector. Lower CV scores indicate more predictable costs, while higher scores suggest greater budget flexibility requirements. This metric helps advertisers plan seasonal spending allocations effectively.
Seasonality impacts extend beyond traditional holiday periods in many industries examined. Healthcare advertising costs fluctuate based on insurance enrollment periods and medical procedure timing. Travel advertising responds to vacation planning cycles and economic confidence indicators affecting discretionary spending.
Geographic factors influence pricing though the analysis focuses primarily on aggregate performance across locations. International expansion advertising faces different cost structures and competitive landscapes depending on target markets and local economic conditions.
Attribution challenges grow as campaigns span multiple Google advertising formats and external marketing channels. The analysis indicates that marketers struggle with Performance Max attribution transparency, creating difficulties in optimizing mixed-media approaches. Cross-channel measurement requires sophisticated tracking implementations.
Customer lifetime value calculations become more important for justifying premium advertising costs in competitive industries. Software and Healthcare sectors demonstrate how higher customer values support elevated acquisition spending. This metric helps rationalize cost differences between industries.
Return on ad spend measurements require longer attribution windows for considered purchase categories like Automotive and Furniture. Quick conversion metrics may not capture full campaign value for these industries. Extended tracking periods provide more accurate performance assessment for high-value purchases.
The analysis concludes that winning Google advertising strategies require precision targeting, creative differentiation, diversified campaign approaches, and intelligent AI utilization for connecting fragmented performance signals.
Subscribe PPC Land newsletter ✉️ for similar stories like this one. Receive the news every day in your inbox. Free of ads. 10 USD per year.
Subscribe
Timeline
Subscribe PPC Land newsletter ✉️ for similar stories like this one. Receive the news every day in your inbox. Free of ads. 10 USD per year.
Subscribe
Summary
Who: Pixis analyzed advertising performance data from 100 consumer brands across multiple industries, with insights from CEO Chris Parrett of Social Hustle regarding data signal challenges.
What: A comprehensive analysis of $996 million in Google Ads spending revealed significant cost variations by industry, with CPMs ranging from $2.71 (Online Marketplaces) to $383.24 (Software) and detailed performance metrics across search, display, shopping, Performance Max, and video campaigns.
When: The analysis covers January 2024 through February 2025, capturing 14 months of advertising performance data during a period of significant platform changes and economic pressures.
Where: The study examined Google Ads performance across multiple industries including Food & Beverage, Healthcare, Travel, Furniture, Automotive, and others, focusing on U.S. consumer brands.
Why: The benchmark study aims to provide advertisers with industry-specific performance standards and strategic guidance for optimizing Google advertising investments amid rising costs and increasing platform complexity, particularly regarding Performance Max adoption challenges and AI-driven campaign management requirements.
Share this article
The link has been copied!