AI apps earn 41% more per user but churn 30% faster, RevenueCat finds
RevenueCat's 2026 State of Subscription Apps report, built on 115,000 apps and $16B revenue, reveals AI apps earn more but retain users far less than traditional apps.

RevenueCat's 2026 State of Subscription Apps report, built on 115,000 apps and $16B revenue, reveals AI apps earn more but retain users far less than traditional apps.
RevenueCat this month published the full 2026 State of Subscription Apps report, a 339-page benchmark study built on data from over 115,000 applications, more than $16 billion in revenue, and upward of a billion transactions. The findings paint a detailed picture of a market that is simultaneously expanding and fracturing - one where artificial intelligence is reshaping both who builds apps and how much those apps earn, while a structural divide between top performers and everyone else continues to widen.
The report, which covers the 2025 fiscal year as its primary reference period, is the most comprehensive edition RevenueCat has released. According to the company, it manages $1 billion per month in app subscription transactions, representing approximately 20% of all subscription app revenue globally. That scale gives the dataset unusual breadth.
The market-level headline is blunt. The top 25% of apps grew monthly recurring revenue (MRR) by 80% year-over-year. The bottom 25% shrank by 33%. The median app grew MRR by just 5.3% over the same period - and that number conceals enormous divergence. The top 10% of apps exceeded 306% MRR growth, while the bottom decile contracted sharply.
That polarisation is not new, but it is accelerating. As PPC Land reported when Part 1 of this data was released, the subscription app economy is splitting in two, with a small number of apps capturing outsized growth while the middle hollows out.
Realized lifetime value (RLTV) per payer after one year sits at a global median of $23. North American developers lead at $32 - roughly 2.3 times higher than the $14 recorded in India and Southeast Asia. Western Europe sits at $25. These are not trivial gaps. They reflect fundamental differences in purchasing power, pricing norms, and the depth of monetization infrastructure across regions.
The download-to-paid conversion rate at Day 35 (D35) follows a similar geographic pattern. North America's median is 2.6%, against 2.0% in Western Europe and 1.4% in India and Southeast Asia. North America's 90th percentile performers reach 10.4% conversion - a ceiling that no other geography approaches at that percentile.
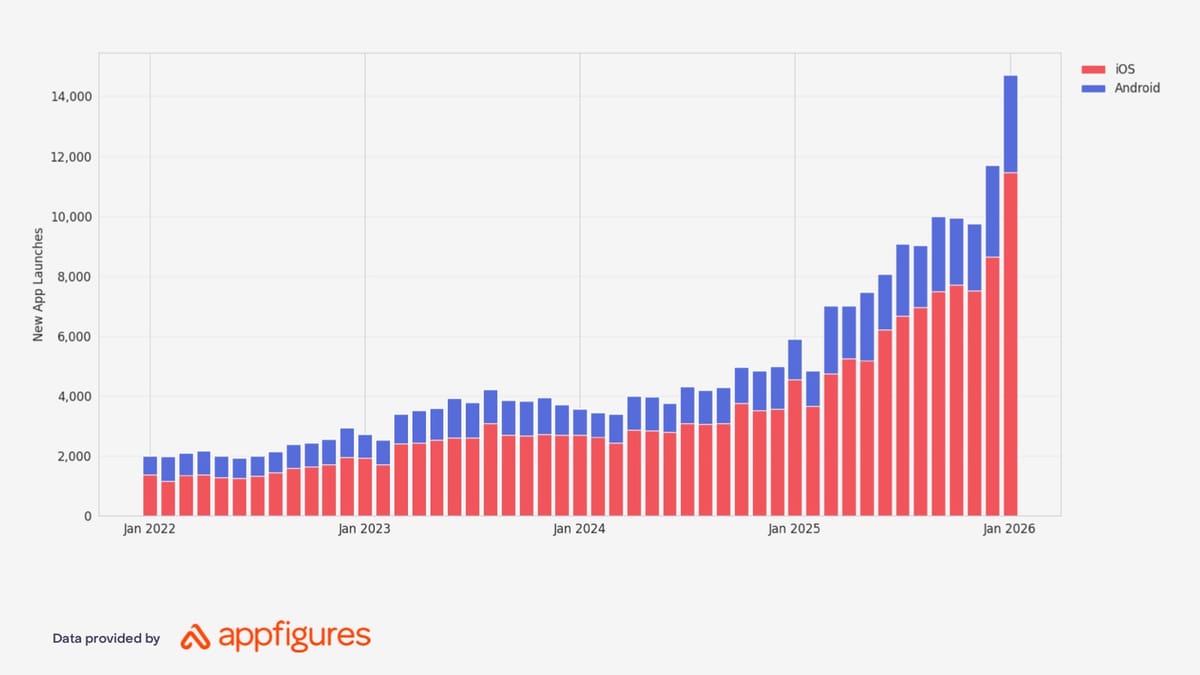
One of the most structurally significant findings in the report concerns the sheer volume of new apps entering the market. According to RevenueCat data provided by Appfigures, monthly new subscription app launches have grown approximately seven times since January 2022. In January 2022, roughly 2,000 new subscription apps launched each month. By January 2026, that figure had reached 14,700.
This growth is almost entirely an iOS story. The App Store now accounts for approximately 77% of all new subscription app launches, up from around 67% in 2023. Android has grown in absolute terms - from roughly 700 new launches per month to around 3,300 - but iOS has outpaced it decisively. The steepest acceleration in iOS launches begins in early 2025, coinciding with the rise of AI-assisted development tools.
The supply surge has not translated into equivalent revenue growth for new entrants. Apps launched before 2020 still generate 69% of all subscription revenue. Apps launched in 2025 or later - what the report terms the "vibecoding era" - account for just 3% of total subscription revenue despite representing a large share of new launches. That figure will be uncomfortable reading for many developers who built new apps in 2025 expecting to benefit from lower barriers to entry.
The report dedicates significant analysis to the paywall model decision that developers face early in product design. The data is clear at the conversion stage: hard paywalls convert at a median of 10.7% by Day 35, compared to 2.1% for freemium apps. That is a five-times difference. The top 10% of hard paywall apps reach 38.7% conversion.
However, the advantage does not persist over time. After one year, retention for hard paywall and freemium apps is nearly identical. Freemium annual plans retain at a 28% median; hard paywalls retain at 27%. Monthly retention is 8% and 9% respectively. The access model, according to the data, is a conversion choice rather than a retention strategy.
What this means in practice is that hard paywalls accelerate revenue recognition without changing the underlying quality of the subscriber relationship. Apps that show a hard paywall upfront convert downloads to paying users at roughly five times the rate of freemium apps with the same ad spend, creating faster payback periods. But the users who were always going to subscribe behave similarly regardless of the model used to acquire them.
The timing of conversion is also highly concentrated. According to the report, 55% of all 3-day trial cancellations happen on Day 0 - the first session. Across all subscription apps, roughly 50% of paid conversions also occur on Day 0. Productivity apps are the extreme case, with 71.9% of all conversions happening on the first day.
One of the most operationally significant findings for Android developers concerns involuntary churn. According to the report, 32.2% of all subscription cancellations on Google Play are billing failures - involuntary, not user-initiated. The equivalent figure on the App Store is 15.2%. That is a gap of more than 17 percentage points, or more than double the iOS rate.
To be precise: on the App Store, 82.9% of cancellations are deliberate unsubscribes. On Google Play, that figure drops to 66.3%, with the remainder being billing errors. Developer-initiated cancellations, price-change cancellations, and pauses account for less than 0.5% on both platforms.
The implications for campaign measurement are significant. AppsFlyer's December 2025 report showed global app marketing spend reaching $109 billion in 2025. A meaningful portion of that spend acquires Android users who then churn not because of product dissatisfaction but because of payment processing failures. For performance marketers optimising cost per acquisition or return on ad spend on Android, the billing error rate represents a structural drag that is largely invisible in standard campaign reporting.
The reasons users who do voluntarily cancel give are dominated by two categories: cost-related reasons (25-45% across categories) and not enough usage (26-40% across categories). Technical issues account for just 3-7% in most categories. Productivity apps show the highest price sensitivity, with 44% of churn attributed to cost-related reasons.
The AI versus non-AI breakdown is one of the most discussed sections of the report, and the numbers carry genuine tension. AI-powered apps generate 41% more realized lifetime value per payer in Year 1 than non-AI apps - $30.16 median versus $21.37. In the first month, that gap is 39% ($18.92 versus $13.59). Trial start rates are 52% higher for AI apps at the median (8.5% versus 5.6%), and download-to-paid conversion is 20% higher (2.4% versus 2.0%).
But AI apps also churn faster, by a wide margin. Monthly 12-month retention for AI apps is 6.1%, compared to 9.5% for non-AI apps. Annual retention is 21.1% for AI apps versus 30.7% for non-AI. Weekly retention is 1.2% against 1.7%. The refund rate is higher too: 4.2% median for AI apps compared to 3.5% for non-AI, with AI apps reaching a ceiling of 16% compared to 12.5% for non-AI.
The pattern suggests that AI hype is creating strong initial purchase intent without creating equivalent long-term value. Users are willing to pay to try AI-powered features; fewer of them stick around long enough to justify the economics at scale. As the report puts it, while AI drives stronger early monetisation, sustaining value remains the challenge.
This dynamic has direct relevance for advertising measurement. Meta's November 2025 announcement of 29% higher ROAS through value optimisation for app advertisers highlighted the importance of identifying high-value users before conversion. For AI app developers using value-based bidding, the higher early revenue per payer makes these users look attractive in optimisation models. The structurally faster churn rate, however, means that predicted LTV inputs need to account for a steeper decay curve than non-AI app benchmarks would suggest.
Currently, 27.1% of all subscription apps are classified as AI-powered. The distribution across categories is uneven. Photo & Video leads at 61.4% - more than twice the all-category average. Productivity sits at 41.1%. Gaming is the outlier at the other end, with just 6.2% of apps in that category classified as AI-powered.
AI apps also structure their subscription plans differently. Monthly plans account for 59.8% of subscriptions sold by AI apps, compared to just 26.2% for non-AI apps. Non-AI apps distribute much more evenly across weekly (30.3%), monthly (26.2%), and yearly (41.8%) durations. The monthly concentration in AI apps is likely both a cause and a consequence of faster churn: monthly billing offers lower commitment and easier cancellation.
The trial length data presents what the report frames as a contradiction between evidence and behaviour. Trials of 17 or more days convert 70% better than short trials - 42.5% versus 25.5% trial-to-paid conversion. Yet apps have been consistently moving toward shorter trials. Nearly half of all apps now use trials of four days or less, a figure that has risen 4.4 percentage points year-over-year. Trials of 17 days or longer account for just 5% of apps, down slightly from the prior year.
The 3-day trial has become dominant. And since 55% of 3-day trial cancellations occur on Day 0, the practical effect is that developers are compressing the window in which they can demonstrate value to exactly the moment when users are least equipped to evaluate it.
Pricing has drifted upward at the annual level but remained flat at shorter durations. The median yearly price increased to $34.80 from $31.60 in the prior period, while the $10 monthly and $5.99 weekly medians held steady. The 90th percentile for yearly pricing expanded to $90, suggesting experimentation with premium tiers at the top end of the market. By category, Education leads annual pricing at $44.99, while Gaming remains structurally lower at $24.99 yearly and $4.99 monthly.
The App Store maintains measurable advantages over Google Play across most early-funnel metrics, though the gaps compress significantly over time. The D60 revenue per install median is $0.42 on the App Store compared to $0.16 on Google Play - a 2.6x difference. By Year 1 RLTV per payer, however, the gap narrows to approximately 8% ($23.38 versus $21.62). Trial-to-paid conversion reaches near parity: 32.6% on iOS versus 32.5% on Android.
Download-to-paid conversion favours iOS at the median - 2.6% versus 0.9% on Google Play - and no category shows Android outperforming iOS at this stage. However, this download-to-paid gap all but disappears once users start a trial, which implies the primary iOS advantage is in getting users to initiate a trial or make a direct purchase in the first place, not in converting them once they have engaged.
The platform revenue concentration is striking. Across every geography, 66-75% of apps generate over 80% of their revenue from the App Store. Apps earning the majority of revenue from Android represent just 5-17% of projects depending on the region. India and Southeast Asia and Latin America show the highest Android-leaning revenue mixes, though iOS still dominates even there.
Adjust's 2026 mobile app report, published in February 2026, provided additional context: global app installs climbed 10% year-over-year in 2025, with consumer spending rising 10.6% to $167 billion. The RevenueCat data suggests that despite broadly rising spending, the revenue gains are distributing unevenly both by platform and by cohort maturity.
One area where the report documents a clear divide between large and small apps concerns web revenue adoption. Among the highest-revenue apps (Tier 5), 41% generate some revenue from web channels. Among hobby-tier apps (Tier 1), that figure is just 1.3%. The difference is 31 times.
This gap does not reflect technical barriers alone. The report notes that web-to-app funnels - where users are acquired and converted outside the App Store before being directed into the app - have moved from niche to mainstream over 2025. Apps that acquire on web, convert outside the in-app purchase mechanism, and then deliver the product experience within the app have the flexibility to use channels and pricing structures unavailable through native store billing. The cost difference between App Store commission rates and direct payment processing is a factor, though the report suggests attribution advantages and media channel flexibility matter equally.
The framework choice data offers a more nuanced finding than the usual native-versus-cross-platform debate. React Native leads on revenue metrics: Day 14 RPI of $0.34, compared to $0.22 for native and $0.19 for Flutter. By Day 60, the gap holds at $0.51 for React Native, $0.31 for native, and $0.29 for Flutter. Year 1 RLTV per payer is $31.78 for React Native versus approximately $20-21 for native and Flutter.
However, annual retention clusters tightly across all frameworks - 27% for native, 27.1% for React Native, 27.8% for Flutter. The revenue advantage for React Native does not translate into a structural loyalty advantage. Within-framework variance on every metric is also far larger than the between-framework gap, suggesting that execution matters considerably more than tooling choice.
The RevenueCat report has direct implications for anyone running paid user acquisition campaigns for subscription apps. The revenue-per-install figures determine the ceiling on acceptable cost per install. If hard paywall apps generate $2.32 per install within two weeks while freemium apps generate $0.27 - a figure referenced in PPC Land's earlier coverage of Part 1 - the budget available for paid acquisition differs by more than eight times between the two models.
For platforms using lifetime value bidding - Google App Campaigns, Meta Advantage+ - the AI app churn data is particularly relevant. AI apps generate higher early RLTV, which makes their users look attractive to optimisation algorithms anchored to 30-day or 60-day LTV windows. But the same users churn at significantly higher rates at 12 months. Bidding strategies calibrated to short-horizon LTV signals for AI apps risk overpaying for users whose long-term value does not support the modelled prediction.
The geographic conversion data adds another layer of complexity. North America's Day 0 conversion rate is 44.2% - the lowest of any geography measured. MEA converts 63.5% of users on Day 0. A blended cost-per-trial target that does not account for this geographic variance will underperform once traffic composition shifts, as Marcus Burke notes in the report's expert commentary section. The practical implication is that geo-segmented bidding and attribution windows likely matter more than most teams currently treat them.
The billing error rate on Google Play - 32.2% of cancellations being involuntary - also affects how Android campaigns should be evaluated. Blended churn metrics that do not separate involuntary from voluntary cancellations will underestimate the addressable retention opportunity and potentially misprice the long-term value of Android users.
Who: RevenueCat, a San Francisco-based company that manages in-app subscription infrastructure and processes approximately $1 billion per month in subscription transactions, representing around 20% of global subscription app revenue.
What: The 2026 State of Subscription Apps (SOSA 2026) report - a 339-page benchmark study covering subscription app performance across monetisation, retention, paywall design, trial length, billing health, platform economics, and AI versus non-AI app dynamics. The dataset spans over 115,000 apps, more than $16 billion in revenue, and over one billion transactions, with 2025 as the primary reference year.
When: Published today, March 14, 2026. The primary data period covers 2025, with some metrics referencing data from 2024 for multi-year calculations such as third annual renewal rates. Launch volume data extends from February 2022 through February 2026.
Where: The findings apply globally across iOS and Android ecosystems, with geographic breakdowns covering North America, Western Europe, Asia-Pacific, Latin America, the Middle East and Africa, and India and Southeast Asia. The billing error data specifically concerns the Google Play platform, where involuntary churn rates are more than double those observed on Apple's App Store.
Why: The report matters because it documents structural shifts that directly affect how subscription apps are built, priced, marketed, and measured. The five-times conversion advantage for hard paywalls, the 41% revenue premium for AI apps paired with 30%+ faster churn, and the 32.2% involuntary cancellation rate on Google Play each carry specific implications for user acquisition spending, bidding strategy, LTV modelling, and retention investment decisions. For performance marketers running campaigns across Google App Campaigns, Meta Advantage+, and other mobile platforms, the data provides benchmarks against which to evaluate whether current campaign economics and attribution windows are calibrated to the actual behaviour of subscription app users in 2025 and 2026.